When data are available and you want to estimate a statistical distribution from them, you can use the JMP distribution-fitting tool. To access the JMP distribution-fitting tool:
-
Make sure the JMP server has been launched. (See the section Launching Local SAS and JMP Servers in Chapter 3: Introduction to SAS Simulation Studio, for details.)
-
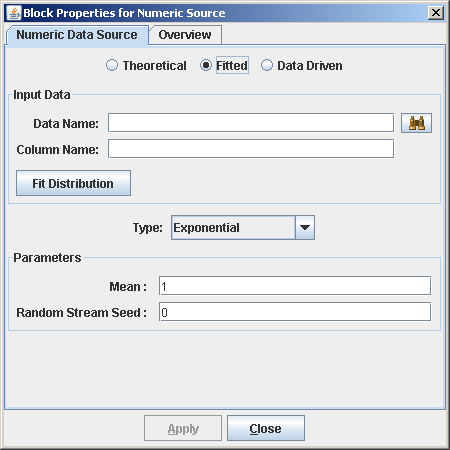
In a Simulation Studio model, open the Block Properties dialog box for a Numeric Source block. (See Figure Figure D.1). Select the Fitted option on the Numeric Data Source tab.
-
In the Data Name field of the Input Data section, specify the pathname of the data set that you want to fit a theoretical distribution to. The data could be a specific column from a SAS data set or JMP table or it could be contained in a text file.
-
In the Column Name field, specify the name of the column in the data set that you want to fit. If the data are contained in a text file, the column name should be the first entry.
-
Click Fit Distribution.
-
Simulation Studio displays a message to alert you that the JMP server is waiting for input. (See Figure D.2).
-
Click OK in this message box.
-
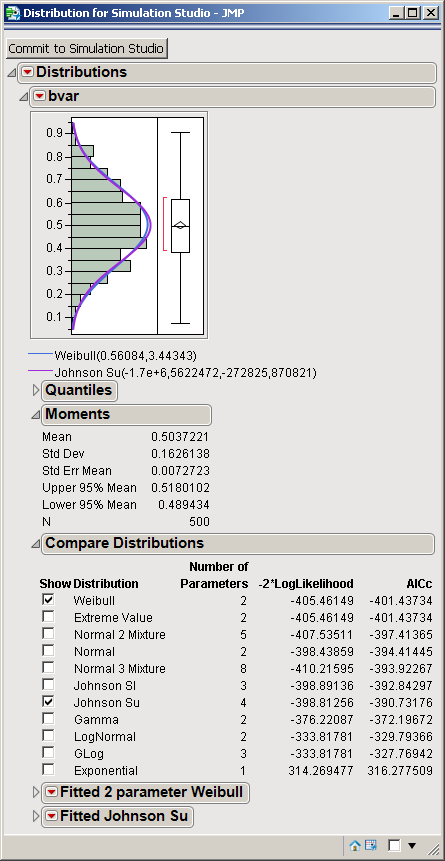
Change focus to your JMP window to view the distribution-fitting results in the Compare Distributions section of the Distribution for Simulation Studio-JMP window. (See Figure D.3). See the JMP documentation for specific information about distribution fitting (specifically, the JMP Fit All option is used by Simulation Studio to generate the distribution fitting results).
-
In the Compare Distributions section, select the check box beside each distribution that you are interested in viewing. Figure D.3 shows the Distribution for Simulation Studio - JMP window for a data column labeled bvar. The first distribution in the list (Weibull) is the top-ranked fit. The distribution Johnson Su is also checked. For each selected distribution, the corresponding density curve is shown overlaid on a histogram of the data. The fitted parameters are also provided for each selected distribution.
-
After viewing the fits, click Commit to Simulation Studio at the top of the window. A dialog box appears with a list of the selected distributions.
-
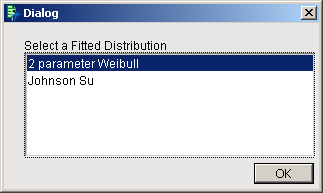
Click the distribution that you want to pass back to Simulation Studio to use in the model. Figure D.4 shows the Distribution Selection dialog box with the 2 parameter Weibull selected.
-
Click OK in this dialog box. The Type and Parameters fields of the Block Properties for Numeric Source dialog box are populated with the appropriate information from the JMP distribution-fitting tool.
If you select a distribution in JMP that is not currently supported in Simulation Studio, then you receive an unsupported distribution error message.
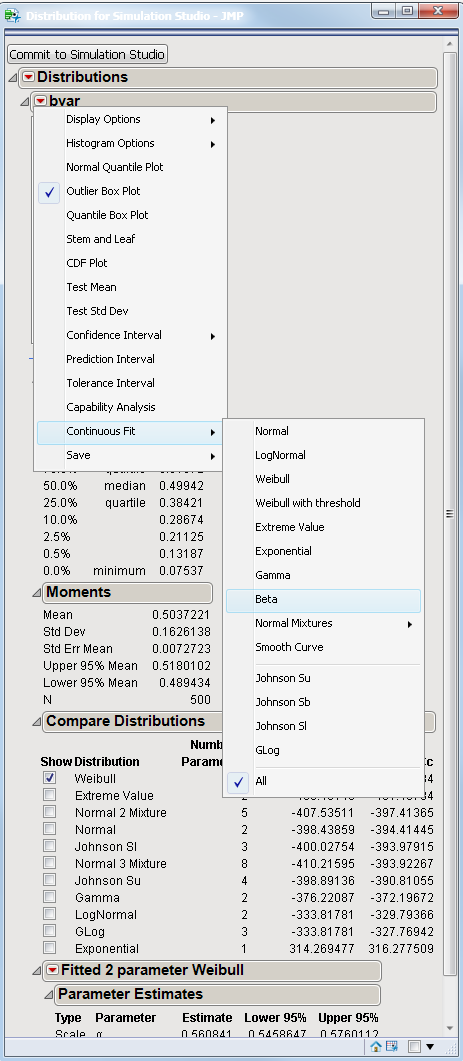
The JMP Fit All option does not include bounded distributions (such as beta or Johnson bounded) in its automated fitting algortihm. However, these bounded distributions can be fit using the Continuous Fit option from the JMP menu that is associated with the current data set in the Distribution for Simulation Studio – JMP window, as shown in Figure D.5. The parameters for fitted distributions that are obtained by using the Continuous Fit option can still be automatically passed back to Simulation Studio by clicking the Commit to Simulation Studio button.