| Formatting Variables and Values |
Assigning Formats
By default, SAS/INSIGHT software displays each variable using the format supplied in your SAS data set. If your data set contains numeric variables with no formats, SAS/INSIGHT software chooses a format based on that variable's values. When you save the data, formats chosen by SAS/INSIGHT software are not automatically saved, but any formats you assign are saved.
You can assign formats by using the Edit:Formats menu.
| Open the BASEBALL data set. |
This data set contains statistics and salaries of major league baseball players.
| Select the variable SALARY. |
| Choose Edit:Formats:9.1. |
![[menu]](images/for_foreq1.gif)
Figure 24.3: Edit:Formats Menu
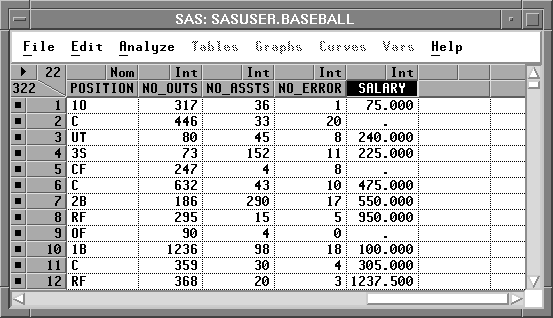
This gives the variable SALARY a width of nine character positions, including the decimal and one position after the decimal. The actual data values for SALARY continue to be stored with double precision.
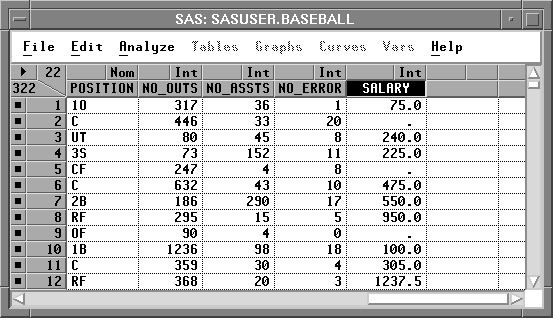
Figure 24.4: Format 9.1
| Choose Edit:Formats:E12. |
This gives the variable SALARY a width of 12 character positions and expresses each value in exponential notation.
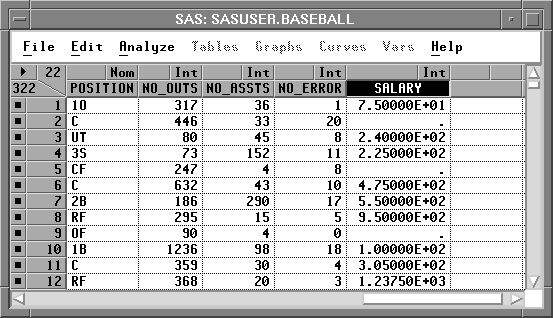
Figure 24.5: Format E12.
The Edit:Formats menu provides quick access to frequently used formats. There are many other standard formats provided by the SAS System.
| Choose Edit:Formats:Other. |
![[menu]](images/for_foreq2.gif)
Figure 24.6: Edit:Formats Menu
This displays the Format dialog. In the dialog, the fields w and d specify the width and decimal places to be used by the formats. Note that the SALARY variable and the E12. format are currently selected.
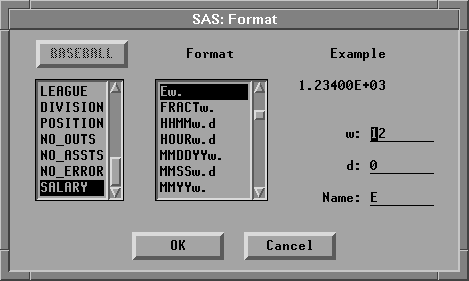
Figure 24.7: Format Dialog
| Select DOLLARw.d in the Format list. |
Formats are listed alphabetically, so the DOLLARw.d format is above the Ew. format.
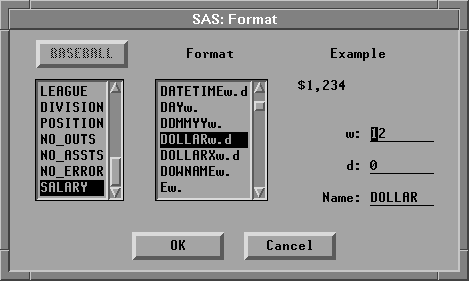
Figure 24.8: Format DOLLARw.d
The example in the upper right corner of the dialog illustrates the format you have selected. DOLLAR is the standard format for display of currency in the United States. There is also a DOLLARX format sometimes preferred in European countries.
| Click OK to set the format you prefer. |

Figure 24.9: SALARY Formatted
Now the variable SALARY uses the format you assigned. By default, this format is also used for axes in subsequent analyses. You can modify the axes, however, to use other formats.
| Choose Analyze:Distribution ( Y ). |
This creates a distribution analysis of SALARY. The box plot and histogram axes use the format you assigned to the SALARY variable in the data window.
| Select SALARY in the distribution window. |
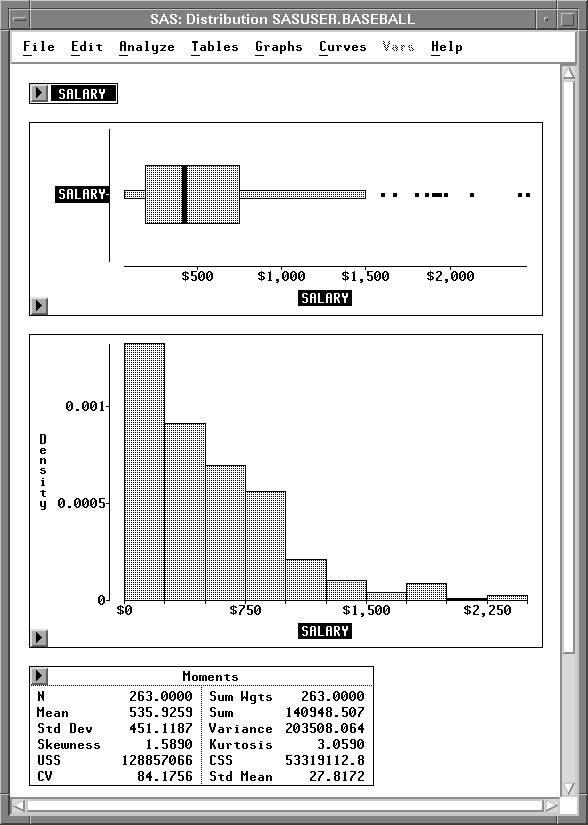
Figure 24.10: Distribution Analysis, SALARY Selected
| Choose Edit:Formats:8.0. |
This assigns the 8.0 format to SALARY on axes in the distribution window. In the data window, SALARY continues to use the DOLLAR format.
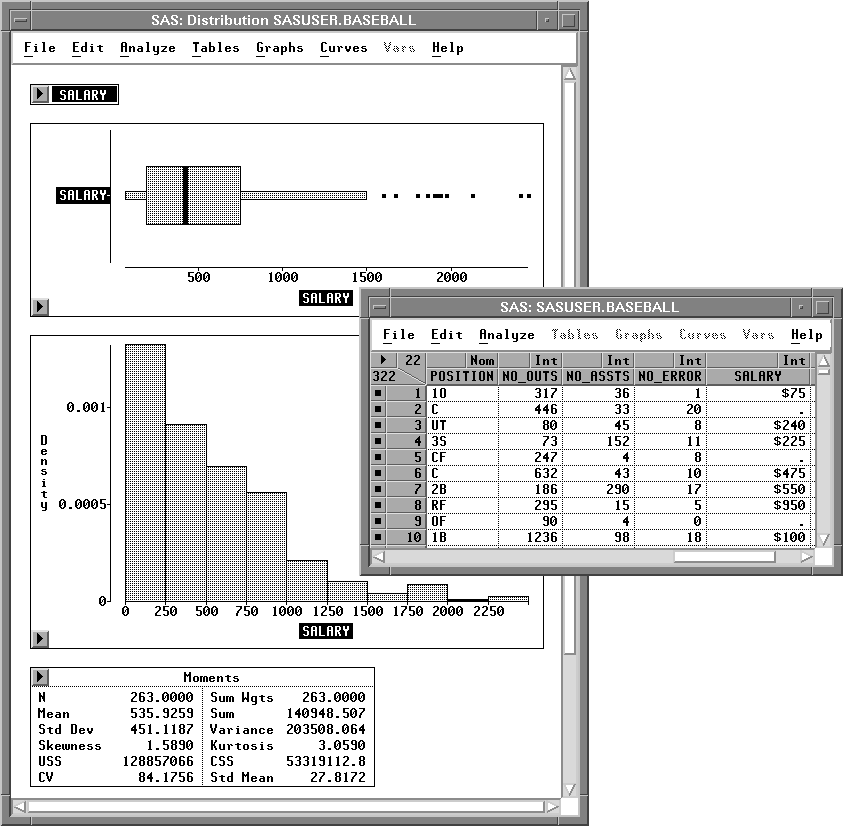
Figure 24.11: SALARY Axes Formatted
You can also format individual values in analysis tables. For example, suppose you need to see greater precision for the mean and standard deviation.
| Select the values for Mean and Std Dev in the Moments table. |
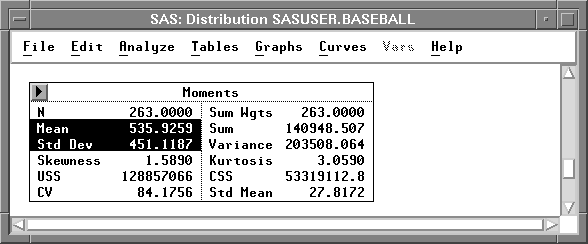
Figure 24.12: Moments Table, Values Selected
| Choose Edit:Formats:14.6. |
Now the mean and standard deviation show six digits after the decimal.
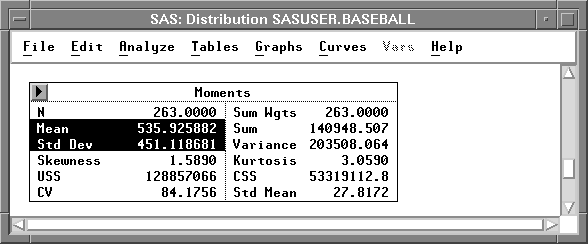
Figure 24.13: Moments Table, Values Formatted
Copyright © 2007 by SAS Institute Inc., Cary, NC, USA. All rights reserved.