The SHEWHART Procedure
Preliminary Examination of Variation
As a preliminary step in the analysis, the data are sorted by lane and visually screened for outliers (test values greater than 130) with box plots created as follows:
ods graphics off;
proc sort data=Film;
   by Lane;
run;
symbol v = dot h = 2.0 pct;
title 'Outlier Analysis';
proc shewhart data=Film;
   boxchart Testval*Lane / boxstyle = schematicid
                           idsymbol = dot
                           vref     = 130
                           vreflab  = 'Outlier Cutoff'
                           hoffset  = 5
                           nolegend
                           stddevs
                           nolimits ;
   id Sample;
run;
Specifying BOXSTYLE=
SCHEMATICID requests schematic box plots with outliers identified by the value of the ID variable Sample. The STDDEVS
option specifies that the estimate of the process standard deviation is to be based on subgroup standard deviations. Although
this estimate is not needed here because control limits are not displayed, it is recommended that you specify the STDDEVS
option whenever you are working with subgroup sample sizes greater than ten. The NOLEGEND
and NOLIMITS
options suppress the subgroup sample size legend and control limits for lane means that are displayed by default. The display
is shown in Figure 18.200.
Figure 18.200: Outlier Analysis for the Data Set Film
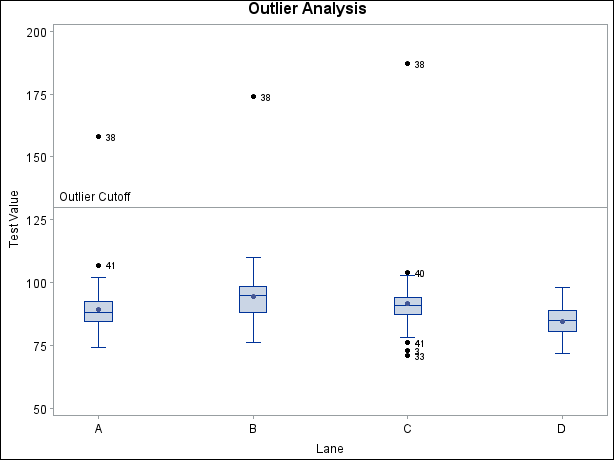
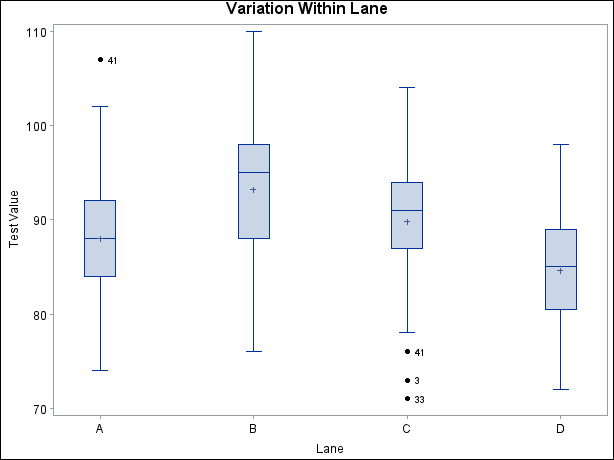
Figure 18.201 shows similarly created box plots for the data in Film2, which is created by removing the outliers from the data set Film.
data Film2;
   set Film;
   if Testval < 130;
symbol h = 2.0 pct;
title 'Variation Within Lane';
proc shewhart data=Film2;
   boxchart Testval*Lane / boxstyle = schematicid
                           boxwidth = 5
                           idsymbol = dot
                           hoffset  = 5
                           nolegend
                           stddevs
                           nolimits ;
   id Sample;
run;
Figure 18.201: The Data Set Film2 Without Outliers
Because you have no additional information about the process, you might want to create a conventional  and R chart for the test values grouped by the variable
 Sample. This is a straightforward application of the XRCHART statement in the SHEWHART procedure.
proc sort data=Film2;
by Sample;
run;
symbol h=2.0 pct;
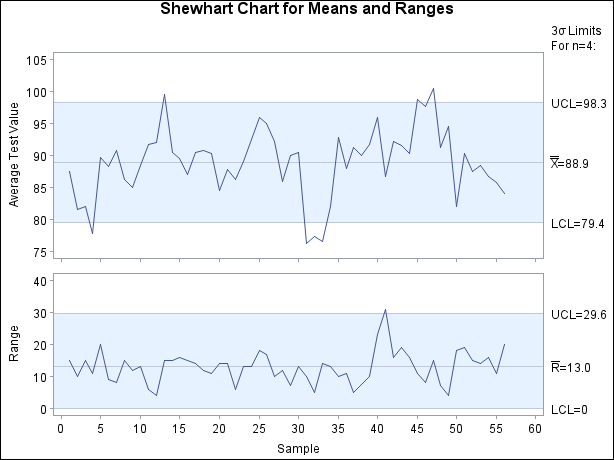
title 'Shewhart Chart for Means and Ranges';
proc shewhart data=Film2;
xrchart Testval*Sample /
split = '/'
npanelpos = 60
limitn = 4
outlimits = RLimits
nolegend
alln;
label Testval='Average Test Value/Range';
run;
The and R chart is displayed in Figure 18.202. Ordinarily, the out-of-control points in the chart would indicate that the process is not in statistical control. In this situation, however, the process is known to
be quite stable, and the data have been screened for outliers. The problem is that the control limits for the average test
value were computed from an inappropriate model. This is discussed in the following section.
Figure 18.202: Conventional and R Chart