The SHEWHART Procedure
Applying Tests to Range and Standard Deviation Charts
Note: See Applying Tests for Special Causes-R charts in the SAS/QC Sample Library.
If you are using the MRCHART, RCHART, SCHART, XRCHART, or XSCHART statement, you can use the TESTS2= option to request tests for special causes with an R chart or s chart. The syntax and test definitions for the TESTS2= option are identical to those for the TESTS= option, and you can use the ZONES2 and ZONE2LABELS options to display the zones on the secondary chart.
The following statements request Test 1 for a range chart of the data in Assembly (see Requesting Standard Tests):
ods graphics off;
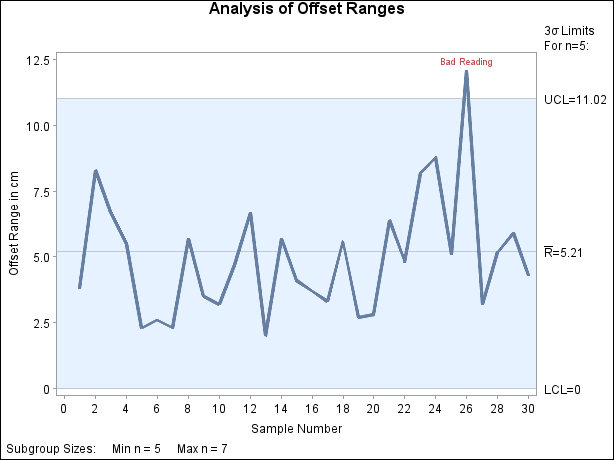
title 'Analysis of Offset Ranges';
proc shewhart history=Assembly;
rchart Offset * Sample / sigma0 = 2.24
limitn = 5
alln
tests2 = 1
testlabel = (comment) ;
label OffsetR = 'Offset Range in cm';
run;
The R chart is shown in Figure 18.187.
Figure 18.187: Range Chart with Test 1
Caution: Except for requesting Test 1, use of the TESTS2= option is not recommended for general process control work. At the time of this writing, there is insufficient published research supporting the application of the other tests to R charts and s charts. There are no established guidelines for interpreting the other tests, nor are there assessments of their false signal probabilities or average run length characteristics. The TESTS2= option is intended primarily as a research tool.