The SHEWHART Procedure
Specifying the Method of Standardization
Note: See Standardization Method on Star Charts in the SAS/QC Sample Library.
In the previous examples in this section, the default method of standardization (based on ranges) is used for all six vertex
variables. You can specify alternative methods with the STARSPECS=
option. For example, specifying STARSPECS=3 standardizes each vertex variable so that the inner circle corresponds to three
standard deviations below the mean and the outer circle corresponds to three standard deviations above the mean (that is,
the circles represent  limits). Specifying STARSPECS=k requests circles corresponding to
  limits, and specifying STARSPECS=0 requests the default method.
In some applications, it might be necessary to use distinct methods of standardization for the vertex variables. You can do this by creating an input SAS data set that provides the method for each vertex variable and specifying this data set with the STARSPECS= option.
The following statements create a data set named myspecs that specifies standardization methods for the vertex variables used in the previous examples:
data myspecs;
   length _var_     $8
          _label_   $16 ;
   input  _var_ _label_ _lspoke_ _sigmas_ _lsl_ _usl_ ;
   datalines;
thick    Thickness    1       .     0.25  0.50
gloss    Gloss        1       .     0.10  0.60
defects  Defects      1       .     0.10  0.60
dust     Dust         2      3.0     .     .
humid    Humidity     2      0.0     .     .
temp     Temperature  2      0.0     .     .
;
This data set contains a number of special variables whose names begin and end with an underscore.
|
Variable Name |
Description |
|---|---|
|
|
Label for identifying the vertex (used in conjunction with the STARLABEL= option). This must be a character variable of length 16 or less. |
|
|
Lower specification limit |
|
|
Line style for spokes used with STARTYPE=RADIAL, STARTYPE=SPOKE, and STARTYPE=WEDGE |
|
|
Multiple of standard deviations above and below the average. A value of zero specifies standardization based on the range. |
|
|
Upper specification limit |
|
|
Name of vertex variable. This must be a character variable whose length is no greater than 32. |
Standardization is specified with the variables _SIGMAS_, _LSL_, and _USL_, as follows:
-
Because nonmissing specification limits (
_LSL_and_USL_) are provided for the variablesthick,gloss, anddefects, the values of these variables are scaled so that the inner circle represents the lower specification limit and the outer circle represents the upper specification limit. -
Because
_SIGMAS_is equal to 3 fordust(and because both_LSL_and_USL_are missing), values ofdustare scaled so that the inner circle represents three standard deviations below the mean, and the outer circle represents three standard deviations above the mean. The mean and standard deviation are calculated across all subgroups. -
Because
_SIGMAS_is equal to 0 forhumidandtemp(and because both_LSL_and_USL_are missing), values ofhumidandtempare scaled so that the inner circle represents the minimum and the outer circle represents the maximum. The minimum and maximum are calculated across all subgroups.
The following statements use the data set myspecs to create a star chart for paint index:
ods graphics on;
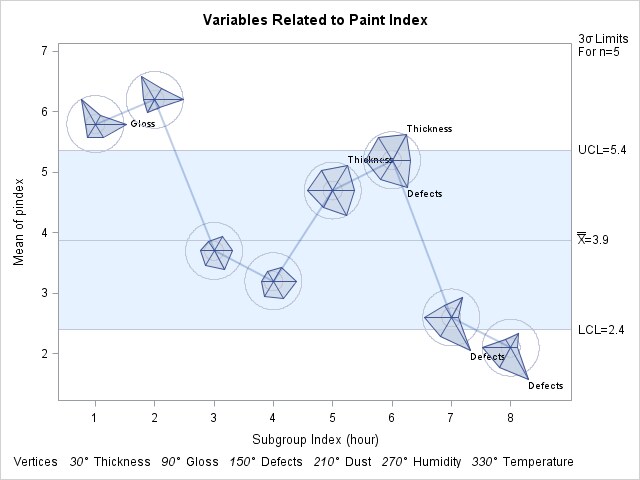
title 'Variables Related to Paint Index';
proc shewhart history=Paint limits=Paintlim;
xchart pindex * hour /
nolegend
odstitle = title
starvertices = ( thick gloss defects dust humid temp )
startype = wedge
starcircles = 0.0 1.0
lstarcircles = 2 2
starstart = -30
labelfont = simplex
starlegend = degrees
starspecs = myspecs
starlabel = high ;
run;
The chart is shown in Figure 18.164. Specifying STARLEGEND= DEGREES requests a legend that identifies the vertex variables by their angles (in degrees) rather than their clock positions. Here, zero degrees corresponds to twelve o’clock, and the degrees are measured clockwise. The first vertex variable is positioned at 30 degrees, as specified with the STARSTART= option. Note that you specify the STARSTART= value as a negative number to indicate that it is in degrees.
In Figure 18.161 the vertices that exceed the outer circle are labeled with the value of the variable _LABEL_ in the STARSPECS= data set. This type of labeling is requested by specifying STARLABEL=HIGH. A font (SIMPLEX) for the labels
is specified with the LABELFONT= option.
The vertices for thick at hour=5, 6, and 7 are truncated, as indicated in the SAS log. The truncation value is the physical radius of an imaginary circle
referred to as the bounding circle that lies outside the outer circle. In general, any vertex that exceeds the bounding circle is truncated to the bounding radius. This is done so that unusually large vertex variable values will not result in grossly distorted stars. You can specify
a different bounding radius with the STARBDRADIUS=
option.
The spokes corresponding to the environmental variables dust, humid, and temp are drawn with a dashed line style to distinguish them from the quality variables thick, gloss, and defects, whose spokes are drawn with a solid line. The styles are specified by the variable _LSPOKE_. Refer to
SAS/GRAPH: Reference for a complete list of line styles. If you are producing charts in color, you can also use the variable _CSPOKE_ in the STARSPECS= data set to assign colors to the spokes.
Figure 18.164: Star Chart Using STARSPECS= Specifications
For more information about the options used in this example, see the appropriate entries in Dictionary of Options: SHEWHART Procedure.