The SHEWHART Procedure
Options for Traditional Graphics
-
ANNOTATE=SAS-data-set
ANNO=SAS-data-set -
specifies an ANNOTATE= type data set, as described in SAS/GRAPH: Reference, that enhances a primary chart. The ANNOTATE= data set specified in a chart statement enhances all charts created by that particular statement. You can also specify an ANNOTATE= data set in the PROC SHEWHART statement to enhance all primary charts created by the procedure.
-
ANNOTATE2=SAS-data-set
ANNO2=SAS-data-set -
specifies an ANNOTATE= type data set, as described in SAS/GRAPH: Reference, that enhances a secondary chart. The ANNOTATE2= data set specified in a chart statement enhances all charts created by that particular statement. You can also specify an ANNOTATE2= data set in the PROC SHEWHART statement to enhance all secondary charts created by the procedure.
This option is available in the IRCHART, MRCHART, XRCHART, and XSCHART statements and in the BOXCHART, MCHART, and XCHART statements with the TRENDVAR= option.
- BILEVEL
-
arranges the Shewhart chart in two levels (rather than the default of one level) so that twice as much data can be displayed on a page or screen. The second level is a continuation of the first level, and this arrangement is continued on subsequent pages until all the subgroups are displayed. You use the NPANELPOS= option to control the number of subgroup positions in each level. If you specify the BILEVEL option in a chart statement that produces primary and secondary charts, you must also specify the SEPARATE option.
-
CAXIS=color
CAXES=color
CA=color -
specifies the color for the axes and tick marks. This option overrides any COLOR= specifications in an AXIS statement.
- CBLOCKLAB=color | (color-list)
-
specifies fill colors for the frames that enclose the block-variable labels in a block legend. By default, these areas are not filled. Colors in the CBLOCKLAB= list are matched with block-variables in the order in which they appear in the chart statement. Related options are BLOCKLABELPOS= , BLOCKLABTYPE= , BLOCKREP , BLOCKPOS= , and CBLOCKVAR= .
- CBLOCKVAR=variable | (variable-list)
-
specifies variables whose values are colors for filling the background of the legend associated with block-variables. Each CBLOCKVAR= variable must be a character variable of no more than eight characters in the input data set (a DATA= , HISTORY= , or TABLE= data set). A list of CBLOCKVAR= variables must be enclosed in parentheses. You can use the BLOCKVAR= option to specify that the block variable legend be filled with different colors from the ODS style.
The procedure matches the CBLOCKVAR= variables with block-variables in the order specified. That is, each block legend will be filled with the color value of the CBLOCKVAR= variable of the first observation in each block. In general, values of the ith CBLOCKVAR= variable are used to fill the block of the legend corresponding to the ith block-variable. For examples of the CBLOCKVAR= option, see Figure 18.146 and Figure 18.147.
By default, fill colors are not used for the block-variable legend. The CBLOCKVAR= option is available only when block-variables are used in the chart statement.
-
CBOXES=color
CBOXES=(variable) -
specifies the colors for the outlines of the box-and-whisker plots created with the BOXCHART statement. You can use one of the following approaches:
-
You can specify CBOXES=color to provide a single outline color for all the box-and-whisker plots.
-
You can specify CBOXES=(variable) to provide a distinct outline color for each box-and-whisker plot as the value of the variable. The variable must be a character variable of length 8 less in the input data set, and its values must be valid SAS/GRAPH color names. The outline color of the plot displayed for a particular subgroup is the value of the variable in the observations corresponding to this subgroup. Note that if there are multiple observations per subgroup in the input data set, the values of the variable should be identical for all the observations in a given subgroup.
You can use the BOXES= option to group boxes to be drawn with different colors from the ODS style.
The CBOXES= option is available only in the BOXCHART statement.
-
-
CBOXFILL=color
CBOXFILL=(variable) -
specifies the interior fill colors for the box-and-whisker plots created with the BOXCHART statement. You can use one of the following approaches:
-
You can specify CBOXFILL=color to provide a single color for all of the box-and-whisker plots.
-
You can specify CBOXFILL=(variable) to provide a distinct color for each box-and-whisker plot as the value of the variable. The variable must be a character variable of length 8 or less in the input data set, and its values must be valid SAS/GRAPH color names (or the value EMPTY, which you can use to suppress color filling). The interior color of the plot displayed for a particular subgroup is the value of the variable in the observations corresponding to this subgroup. Note that if there are multiple observations per subgroup in the input data set, the values of the variable should be identical for all the observations in a given subgroup.
You can use the BOXFILL= option to group boxes to be filled with different colors from the ODS style. By default, all boxes are filled with a single color from the ODS style. The CBOXFILL= option is available only in the BOXCHART statement.
-
- CCLIP=color
-
specifies a color for the plotting symbol that is specified with the CLIPSYMBOL= option to mark clipped points. The default color is the color specified in the COLOR= option in the SYMBOL1 statement.
- CCONNECT=color
-
specifies the color for the line segments connecting points on the chart. The default color is the color specified in the COLOR= option in the SYMBOL1 statement. This option is not applicable in the BOXCHART statement unless you also specify the BOXCONNECT option.
- CCOVERLAY=(color-list)
-
specifies the colors for the line segments connecting points on primary chart overlays. Colors in the CCOVERLAY= list are matched with variables in the corresponding positions in the OVERLAY= list. By default, points are connected by line segments of the same color as the plotted points. You can specify the value NONE to suppress the line segments connecting points on an overlay.
- CCOVERLAY2=(color-list)
-
specifies the colors for the line segments connecting points on secondary chart overlays. Colors in the CCOVERLAY2= list are matched with variables in the corresponding positions in the OVERLAY2= list. By default, points are connected by line segments of the same color as the plotted points. You can specify the value NONE to suppress the line segments connecting points on an overlay.
-
CFRAME=color
CFRAME=(color-list) -
specifies the colors for filling the rectangle enclosed by the axes and the frame. By default, this area is not filled. The CFRAME= option cannot be used in conjunction with the NOFRAME option.
You can specify a single color to fill the entire area. Alternatively, if you are displaying phases (blocks) of data read with the READPHASES= option, you can specify a color-list with the CFRAME= option to fill the sub-rectangles of the framed area corresponding to the phases. The colors, in order of specification, are applied to the sub-rectangles starting from left to right. You can use the value EMPTY in the color-list to avoid filling a particular sub-rectangle. If the number of colors is less than the number of phases, the colors are applied cyclically. The colors are also used for phase legends requested with the PHASELEGEND option.
- CGRID=color
-
specifies the color for the grid requested by the ENDGRID or GRID option. By default, the grid is the same color as the axes.
- CHREF=color
-
specifies the color for the lines requested by the HREF= and HREF2= options.
- CLABEL=color
-
specifies the color for labels produced by the ALLLABEL= , ALLLABEL2= , OUTLABEL= , and OUTLABEL2= options.
- CLIMITS=color
-
specifies the color for the control limits, the central line, and the labels for these lines.
- CLIPLEGPOS=TOP | BOTTOM
-
specifies the position for the legend that indicates the number of clipped points when the CLIPFACTOR= option is used. The keywords TOP and BOTTOM position the legend at the top or bottom of the chart, respectively. Do not specify CLIPLEGPOS=TOP together with the PHASELEGEND option or the BLOCKPOS= 1 or BLOCKPOS=2 options. By default, CLIPLEGPOS=BOTTOM.
- CLIPSYMBOL=symbol
-
specifies a plot symbol used to identify clipped points on the chart and in the legend when the CLIPFACTOR= option is used. You should use this option in conjunction with the CLIPFACTOR= option. The default symbol is CLIPSYMBOL=SQUARE.
- CLIPSYMBOLHT=value
-
specifies the height for the symbol marker used to identify clipped points on the chart when the CLIPFACTOR= option is used. The default is the height specified with the H= option in the SYMBOL statement.
For general information about clipping options, refer to Clipping Extreme Points.
- CNEEDLES=color
-
requests that points are to be connected to the central line with vertical line segments (needles) and specifies the color of the needles. You can use needles to visually represent the process as a series of shocks or vertical displacements away from a constant mean. See Figure 18.168 for an example. The CNEEDLES= option is available in all chart statements except the BOXCHART statement.
- COUTFILL=color
-
specifies the fill color for the areas outside the control limits that lie between the connected points and the control limits and are bounded by connecting lines. This option is useful for highlighting out-of-control points. See Figure 18.203 for an example. By default, these areas are not filled. You can use the OUTFILL option to fill this area with an appropriate color from the ODS style. Note that you can use the CINFILL= option to fill the area inside the control limits.
- COVERLAY=(color-list)
-
specifies the colors used to plot primary chart overlay variables. Colors in the COVERLAY= list are matched with variables in the corresponding positions in the OVERLAY= list.
- COVERLAY2=(color-list)
-
specifies the colors used to plot secondary chart overlay variables. Colors in the COVERLAY2= list are matched with variables in the corresponding positions in the OVERLAY2= list.
- COVERLAYCLIP=color
-
specifies the color used to plot clipped values on overlay plots when the CLIPFACTOR= option is used.
- CPHASELEG=color
-
specifies a text color for the phase labels requested with the PHASELEGEND option. By default, if you specify a list of fill colors with the CFRAME= option, these colors are used for the corresponding phase labels, otherwise, the CTEXT= color is used for the phase labels.
- CSTARCIRCLES=color
-
specifies a color for the circles requested with the STARCIRCLES= option. See Displaying Auxiliary Data with Stars. By default, the color specified with the CSTARS= option is used.
-
CSTARFILL=color
CSTARFILL=(variable) -
specifies a color or colors for filling the interior of stars requested with the STARVERTICES= option. You can use one of the following approaches:
-
Specify a single color to be used for all stars with CSTARFILL=color.
-
Specify a distinct color for each star (or subsets of stars) by providing the colors as values of a variable specified with CSTARFILL=(variable). The variable must be a character variable of length 8 or less in the input data set, and its values must be valid SAS/GRAPH colors or the value EMPTY. The color for the star positioned at the ith subgroup on the chart is the value of the CSTARFILL= variable in the observations corresponding to the ith subgroup. Note that if there are multiple observations per subgroup in the input data set (for instance, if you are using the XRCHART statement in the SHEWHART procedure to analyze observations from a DATA= input data set), the values of the CSTARFILL= variable should be identical for all the observations in a given subgroup.
See Displaying Auxiliary Data with Stars.
You can use the STARFILL= option to group stars to be filled with different colors from the ODS style. By default, all stars are filled with a single color from the ODS style.
-
-
CSTARS=color
CSTARS=(variable) -
specifies a color or colors for the outlines of stars requested with the STARVERTICES= option.
You can use one of the following approaches:
-
You can specify a single color to be used for all the stars on the chart with CSTARS=color.
-
You can specify a distinct outline color for each star (or subsets of stars) by providing the colors as values of a variable specified with CSTARS=(variable). The variable must be a character variable of length 8 or less in the input data set. The outline color for the star positioned at the ith subgroup on the chart is the value of the CSTARS=variable in the observations corresponding to the ith subgroup. Note that if there are multiple observations per subgroup in the input data set (for instance, if you are using the XRCHART statement in the SHEWHART procedure to analyze observations from a DATA= input data set), the values of the CSTARS= variable should be identical for all the observations in a given subgroup.
See Displaying Auxiliary Data with Stars.
You can use the STARS= option to group stars to be drawn with different colors from the ODS style. By default, all stars are drawn with a single color from the ODS style.
-
- CTESTLABBOX=color
-
specifies the color for boxes enclosing labels for positive tests for special causes requested with the TESTLABBOX option. If you use the CTESTLABBOX= option, you do not need to specify the TESTLABBOX option.
-
CTESTS=color | test-color-list
CTEST=color | test-color-list -
specifies colors for labels indicating points where a test is positive.
-
You can specify the color for the labels used to identify points at which tests for special causes specified in the TESTS= option are positive. For Tests 2 through 8, this color is also used for the line segments that connect patterns of points for which a test is positive.
-
You can specify the test-color-list to enable different colors to be used for the labels and highlighted line segments associated with different tests for special causes. Any positive tests for which no specific CTESTS= value is specified are displayed using the general CTESTS= color. A non-default general CTESTS= color can be specified using the CTESTS=color syntax.
The following options request the standard tests for special causes 1 through 4 and one user-defined test designated B.
TESTS  = 1 to 4 M(K=4 DIR=DEC Code=B);
CTESTS = green;
CTESTS = (1 purple 3 yellow B blue);
Test 1 will be displayed in purple, Test 3 in yellow, and Test B in blue. Tests 2 and 4 will be displayed in green, the general CTESTS= color.
-
-
CTESTSYMBOL=color
CTESTSYM=color -
specifies the color of the symbol used to plot subgroups with positive tests for special causes.
- CTEXT=color
-
specifies the color for tick mark values and axis labels. This color is also used for the sample size legend and for the control limit legend. The default color is the color specified in the CTEXT= option in the most recent GOPTIONS statement.
-
CVREF=color
CV=color -
specifies the color for reference lines requested by the VREF= and VREF2= options.
- CZONES=color
-
requests lines marking zones A, B, and C for the tests for special causes (see the TESTS= option) and specifies the color for these lines. This color is also used for labels requested with the ZONELABELS option.
-
DESCRIPTION='string'
DES='string' -
specifies a description, up to 256 characters long, for the GRSEG catalog entry for the primary chart. The default string is the variable name. A related option is NAME= .
-
DESCRIPTION2='string'
DES2='string' -
specifies a description, up to 256 characters long, for the GRSEG catalog entry for the secondary chart. The default string is the variable name. The DESCRIPTION2= option is available in the IRCHART, MRCHART, XRCHART, and XSCHART statements, and it is used in conjunction with the SEPARATE option. A related option is NAME2= .
- ENDGRID
-
adds a grid to the rightmost portion of the chart, beginning with the first labeled major tick mark position that follows the last plotted point. This grid is useful in situations where you want to add points by hand after the chart is created. You can use the HAXIS= option to force space to be added to the horizontal axis.
- FONT=font
-
specifies a software font for labels and legends. You can also specify fonts for axis labels in an AXIS statement. The FONT= font takes precedence over the FTEXT= font specified in the GOPTIONS statement. Hardware characters are used by default.
- HEIGHT=value
-
specifies the height (in vertical screen percent units) of the text for axis labels and legends. This value takes precedence over the HTEXT= value specified in the GOPTIONS statement. This option is recommended for use with software fonts specified with the FONT= option or with the FTEXT= option in the GOPTIONS statement. Related options are LABELHEIGHT= and TESTHEIGHT= .
-
HMINOR=n
HM=n -
specifies the number of minor tick marks between each major tick mark on the horizontal axis. Minor tick marks are not labeled. The default is 0.
- HTML=variable
-
specifies a variable whose values create links associated with subgroup points on a primary control chart when traditional graphics output is directed into HTML. You can specify a character variable or formatted numeric variable. The value of the HTML= variable should be the same for each observation with a given value of the subgroup variable. See the section Interactive Control Charts: SHEWHART Procedure for more information.
- HTML2=variable
-
specifies a variable whose values create links associated with subgroup points on a secondary control chart when traditional graphics output is directed into HTML. You can specify a character variable or formatted numeric variable. The value of the HTML2= variable should be the same for each observation with a given value of the subgroup variable. See the section Interactive Control Charts: SHEWHART Procedure for more information.
- HTML_LEGEND=variable
-
specifies HTML links as values of the specified character variable (or formatted values of a numeric variable). These links are associated with symbols in the legend for the levels of a symbol-variable. The value of the HTML_LEGEND= variable should be the same for each observation with a given value of symbol-variable.
- IDCOLOR=color
-
specifies the color of the symbol marker used to identify outliers in schematic box-and-whisker plots produced with the BOXCHART statement when you use one of the following options: BOXSTYLE= SCHEMATIC, BOXSTYLE=SCHEMATICID, and BOXSTYLE=SCHEMATICIDFAR. The default color is the color specified with the CBOXES= option. The IDCOLOR= option is available only in the BOXCHART statement.
- IDCTEXT=color
-
specifies the color for the text used to label outliers or indicate process variable values when you specify one of the keywords SCHEMATICID, SCHEMATICIDFAR, POINTSID, or POINTSJOINID with the BOXSTYLE= option. The default is the color specified with the CTEXT= option.
- IDFONT=font
-
specifies the font for the text used to label outliers or indicate process variable values when you specify one of the keywords SCHEMATICID, SCHEMATICIDFAR, POINTSID, or POINTSJOINID with the BOXSTYLE= option. The default font is SIMPLEX.
- IDHEIGHT=value
-
specifies the height for the text used to label outliers or indicate process variable values when you specify one of the keywords SCHEMATICID, SCHEMATICIDFAR, POINTSID, or POINTSJOINID with the BOXSTYLE= option. The default is the height specified with the HTEXT= option in the GOPTIONS statement.
- IDSYMBOL=symbol
-
specifies the symbol marker used to identify outliers in schematic box-and-whisker plots produced with the BOXCHART statement when you use one of the following options: BOXSTYLE= SCHEMATIC, BOXSTYLE=SCHEMATICID, and BOXSTYLE=SCHEMATICIDFAR. The default symbol is SQUARE. The IDSYMBOL= option is available only in the BOXCHART statement.
- IDSYMBOLHEIGHT=value
-
specifies the height of the symbol marker used to identify outliers in schematic box-and-whisker plots produced with the BOXCHART statement. This option is available only in the BOXCHART statement.
- LABELANGLE=angle
-
specifies the angle at which labels requested with the ALLLABEL= , ALLLABEL2= , OUTLABEL= , and OUTLABEL2= options are drawn. A positive angle rotates the labels counterclockwise; a negative angle rotates them clockwise. By default, labels are oriented horizontally.
-
LABELFONT=font
TESTFONT=font -
specifies a software font for labels requested with the ALLLABEL= , ALLLABEL2= , OUTLABEL= , OUTLABEL2= , STARLABEL= , TESTLABEL= , and TESTLABELn= options. Hardware characters are used by default.
-
LABELHEIGHT=value
TESTHEIGHT=value -
specifies the height (in vertical percent screen units) for labels requested with the ALLLABEL= , ALLLABEL2= , OUTLABEL= , OUTLABEL2= , STARLABEL= , TESTLABEL= , and TESTLABELn= options. The default height is the height specified with the HEIGHT= option or the HTEXT= option in the GOPTIONS statement.
-
LBOXES=linetype
LBOXES=(variable) -
specifies the line types for the outlines of the box-and-whisker plots created with the BOXCHART statement. eou can use one of the following approaches:
-
You can specify LBOXES=linetype to provide a single linetype for all of the box-and-whisker plots.
-
You can specify LBOXES=(variable) to provide a distinct line type for each box-and-whisker plot. The variable must be a numeric variable in the input data set, and its values must be valid SAS/GRAPH linetype values (numbers ranging from 1 to 46). The line type for the plot displayed for a particular subgroup is the value of the variable in the observations corresponding to this subgroup. Note that if there are multiple observations per subgroup in the input data set, the values of the variable should be identical for all of the observations in a given subgroup.
The default value is 1, which produces solid lines. The LBOXES= option is available only in the BOXCHART statement.
-
- LENDGRID=n
-
specifies the line type for the grid requested with the ENDGRID option. The default is n = 1, which produces a solid line. If you use the LENDGRID= option, you do not need to specify the ENDGRID option.
- LGRID=n
-
specifies the line type for the grid requested with the GRID option. The default is n = 1, which produces a solid line. If you use the LGRID= option, you do not need to specify the GRID option.
-
LHREF=linetype
LH=linetype -
specifies the line type for reference lines requested with the HREF= and HREF2= options. The default is 2, which produces a dashed line.
- LLIMITS=linetype
-
specifies the line type for control limits. The default is 4, which produces a dashed line.
- LOVERLAY=(linetypes)
-
specifies line types for the line segments connecting points on primary chart overlays. Line types in the LOVERLAY= list are matched with variables in the corresponding positions in the OVERLAY= list.
- LOVERLAY2=(linetypes)
-
specifies line types for the line segments connecting points on secondary chart overlays. Line types in the LOVERLAY2= list are matched with variables in the corresponding positions in the OVERLAY2= list.
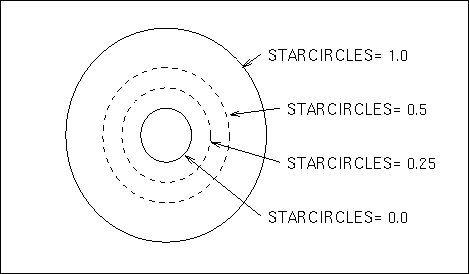
- LSTARCIRCLES=linetypes
-
specifies one or more line types for the circles requested with the STARCIRCLES= option. The number of line types should match the number of circles requested, and the line types are paired with the circles in the order specified. The default linetype is 1, which produces a solid line.
Figure 18.142 illustrates circles displayed by the following LSTARCIRCLES= and STARCIRCLES= options:
starcircles  = 0.0 1.0 0.25 0.5
lstarcircles = 1 1 2 2
Figure 18.142: Line Types for Reference Circles
-
LSTARS=linetype
LSTARS=(variable) -
specifies the line types for the outlines of stars requested with the STARVERTICES= option. You can use one of the following approaches:
-
You can specify LSTARS=linetype to provide a single line type for all of the stars.
-
You can specify LSTARS=(variable) to provide a distinct line type for each star. The variable must be a numeric variable in the input data set, and its values must be valid SAS/GRAPH line types. The line type for the star positioned at a particular subgroup is the value of the variable in the observations corresponding to this subgroup. Note that if there are multiple observations per subgroup in the input data set, the variable values should be identical for all of the observations in a given subgroup.
See Displaying Auxiliary Data with Stars. The default linetype is 1, which produces a solid line.
-
-
LTESTS=linetype
LTEST=linetype -
specifies the line type for the line segments that connect patterns of points for which a test for special causes (requested with the TESTS= option) is positive. The default is 1, which produces a solid line.
-
LVREF=linetype
LV=linetype -
specifies the line type for reference lines requested by the VREF= and VREF2= options. The default is 2, which produces a dashed line.
- LZONES=n
-
specifies the line type for lines that delineate zones A, B, and C for standard tests requested with the TESTS= and/or TESTS2 = options. The default is n = 2, which produces a dashed line.
- NAME='string'
-
specifies the name of the GRSEG catalog entry for the primary chart, and the name of the graphics output file if one is created. The name can be up to 256 characters long, but the GRSEG name is truncated to eight characters. The default name is 'SHEWHART'. A related option is DESCRIPTION= .
- NAME2='string'
-
specifies the name of the GRSEG catalog entry for the secondary chart, and the name of the graphics output file if one is created. The name can be up to 256 characters long, but the GRSEG name is truncated to eight characters. The default name is 'SHEWHART'. The NAME2= option is available in the IRCHART, MRCHART, XRCHART, and XSCHART statements, and it is used in conjunction with the SEPARATE option. A related option is DESCRIPTION2= .
- NOFRAME
- NOLIMITSFRAME
-
suppresses the default frame for the control limit information that is displayed across the top of the chart when multiple sets of control limits with distinct multiples of
 and nominal control limit sample sizes are read from a LIMITS=
data set.
and nominal control limit sample sizes are read from a LIMITS=
data set.
- NOPHASEFRAME
-
suppresses the default frame for the legend requested by the PHASELEGEND option.
- NOVANGLE
-
requests vertical axis labels that are strung out vertically. By default, the labels are drawn at an angle of 90 degrees if a software font is used.
- NOVLABEL
-
suppresses the label for the primary vertical axis. Use the NOVLABEL option when the meaning of the primary vertical axis is evident from the tick mark labels.
- NOV2LABEL
-
suppresses the label for the secondary vertical axis. Use the NOV2LABEL option when the meaning of the secondary vertical axis is evident from the tick mark labels.
- OUTHIGHHTML=variable
-
specifies a variable whose values create links to be associated with outlier points above the upper fence on a schematic box chart when traditional graphics output is directed into HTML.
- OUTLOWHTML=variable
-
specifies a variable whose values create links to be associated with outlier points below the lower fence on a schematic box chart when traditional graphics output is directed into HTML.
- OVERLAY2HTML=(variable-list)
-
specifies variables whose values create links to be associated with points on secondary chart overlays. These links are associated with points on an overlay plot when traditional graphics output is directed into HTML. Variables in the OVERLAY2HTML= list are matched with variables in the corresponding positions in the OVERLAY2= list. The value of the OVERLAY2HTML= variable should be the same for each observation with a given value of the subgroup variable.
- OVERLAY2SYM=(symbol-list)
-
specifies symbols used to plot overlays on a secondary control chart. Symbols in the OVERLAY2SYM= list are matched with variables in the corresponding positions in the OVERLAY2= list.
- OVERLAY2SYMHT=(value-list)
-
specifies the heights of symbols used to plot overlays on a secondary control chart. Heights in the OVERLAY2SYMHT= list are matched with variables in the corresponding positions in the OVERLAY2= list.
- OVERLAYCLIPSYM=symbol
-
specifies the symbol used to plot clipped values on overlay plots when the CLIPFACTOR= option is used.
- OVERLAYCLIPSYMHT=value
-
specifies the height for the symbol used to plot clipped values on overlay plots when the CLIPFACTOR= option is used.
- OVERLAYHTML=(variable-list)
-
specifies variables whose values create links to be associated with points on primary chart overlays. These links are associated with points on an overlay plot when traditional graphics output is directed into HTML. Variables in the OVERLAYHTML= list are matched with variables in the corresponding positions in the OVERLAY= list. The value of the OVERLAYHTML= variable should be the same for each observation with a given value of the subgroup variable.
- OVERLAYSYM=(symbol-list)
-
specifies symbols used to plot overlays on the primary control chart. Symbols in the OVERLAYSYM= list are matched with variables in the corresponding positions in the OVERLAY= list.
- OVERLAYSYMHT=(value-list)
-
specifies the heights of symbols used to plot overlays on the primary control chart. Heights in the OVERLAYSYMHT= list are matched with variables in the corresponding positions in the OVERLAY= list.
- POINTSHTML=variable
-
specifies a variable whose values create links to be associated with points on a box chart when the BOXSTYLE= value is POINTS, POINTSJOIN, POINTSBOX, POINTSID, or POINTSJOINID. These URLs are associated with points on a box chart when traditional graphics output is directed into HTML.
-
TESTFONT=font
LABELFONT=font -
specifies a software font for labels requested with the ALLLABEL= , ALLLABEL2 =, OUTLABEL= , OUTLABEL2= , STARLABEL= , TESTLABEL= , and TESTLABELn= options. Hardware characters are used by default.
-
TESTHEIGHT=value
LABELHEIGHT=value -
specifies the height (in vertical percent screen units) for labels requested with the ALLLABEL= , ALLLABEL2 =, OUTLABEL= , OUTLABEL2= , STARLABEL= , TESTLABEL= , and TESTLABELn= options. The default height is the height specified with the HEIGHT= option or the HTEXT= option in the GOPTIONS statement.
-
TESTSYMBOL=symbol
TESTSYM=symbol -
specifies the symbol for plotting subgroups with positive tests for special causes.
-
TESTSYMBOLHT=value
TESTSYMHT=value -
specifies the height of the symbol used to plot subgroups with positive tests for special causes.
-
TURNALL
TURNOUT -
turns the labels produced by the ALLLABEL= , ALLLABEL2= , OUTLABEL= , and OUTLABEL2= options so that they are strung out vertically. By default, labels are arranged horizontally.
-
TURNHLABELS
TURNHLABEL -
turns the major tick mark labels for the horizontal (subgroup) axis so that they are strung out vertically. By default, labels are arranged horizontally.
If you are producing traditional graphics with the NOGSTYLE option in effect, you should specify a font (with the FONT= option) in conjunction with the TURNHLABELS option. Otherwise, the labels might be displayed with a mixture of hardware and software fonts.
Note: Turning the labels vertically might leave insufficient room on the screen or page for a chart.
-
VMINOR=n
VM=n -
specifies the number of minor tick marks between each major tick mark on the vertical axis. No values are printed on the minor tick marks. By default, VMINOR=0.
- WAXIS=n
-
specifies the width in pixels for the axis and frame lines. By default, n = 1.
- WEBOUT=SAS-data-set
-
produces an output data set containing all the data in an OUTTABLE= data set plus graphics coordinates for points (subgroup summary statistics) that are displayed on a control chart. You can use an WEBOUT= data set to facilitate the development of web-based applications. See Interactive Control Charts: SHEWHART Procedure for details.
- WGRID=n
-
specifies the width in pixels for grid lines requested with the ENDGRID and GRID options. By default, n = 1.
- WLIMITS=n
-
specifies the width in pixels for the control limits and central line. By default, n = 1.
- WNEEDLES=n
-
specifies the width in pixels of needles connecting plotted points to the central line, as requested with the NEEDLES option. If you use the WNEEDLES= option, you do not need to specify the NEEDLES option. By default, n = 1.
- WOVERLAY=(value-list)
-
specifies the widths in pixels for the line segments connecting points on primary chart overlay plots. Widths in the WOVERLAY= list are matched with variables in the corresponding positions in the OVERLAY= list.
- WOVERLAY2=(value-list)
-
specifies the widths in pixels for the line segments connecting points on secondary chart overlay plots. Widths in the WOVERLAY2= list are matched with variables in the corresponding positions in the OVERLAY2= list.
- WSTARCIRCLES=n
-
specifies the width in pixels of the outline of circles requested by the STARCIRCLES= option. See Displaying Auxiliary Data with Stars. By default, n = 1.
- WSTARS=n
-
specifies the width in pixels of the outline of stars requested by the STARVERTICES= option. See Displaying Auxiliary Data with Stars. By default, n = 1.
-
WTESTS=n
WTEST=n -
specifies the width in pixels of the line segments that connect patterns of points for which a test for special causes (requested with the TESTS= or TESTS2 = option) is positive. By default, n = 1.
- WTREND=n
-
specifies the width in pixels of the line segments that connect points on trend charts requested with the TRENDVAR= option. By default, n = 1. The WTREND= option is available in the BOXCHART, MCHART, and XCHART statements.