SAS/QC Graphics
Traditional Graphics
The following SAS/QC procedures support traditional graphics:
-
ANOM
-
CAPABILITY
-
CUSUM
-
MACONTROL
-
PARETO
-
RELIABILITY
-
SHEWHART
These procedures support global SAS statements (such as GOPTIONS, AXIS, and SYMBOL statements) used to control the appearance of traditional graphics. Each procedure also supports a rich set of options providing detailed control of features specific to its graphs.
Prior to SAS 9.2 the default appearance of SAS/QC graphs was primitive. To produce attractive graphical output, careful selection of colors, fonts, and other attributes specified with global statements and procedure options was required. Beginning with SAS 9.2, the default appearance of traditional graphs is determined by the ODS style that is in effect.
An example taken from the Getting Started: HISTOGRAM Statement section of Chapter 5: The CAPABILITY Procedure, demonstrates the alternatives for producing SAS/QC graphics. The following statements create a data set named Trans containing measurements of the thickness of copper plating on 100 printed circuit boards:
data Trans;
   input Thickness @@;
   label Thickness='Plating Thickness (mils)';
   datalines;
3.468 3.428 3.509 3.516 3.461 3.492 3.478 3.556 3.482 3.512
3.490 3.467 3.498 3.519 3.504 3.469 3.497 3.495 3.518 3.523
3.458 3.478 3.443 3.500 3.449 3.525 3.461 3.489 3.514 3.470
3.561 3.506 3.444 3.479 3.524 3.531 3.501 3.495 3.443 3.458
3.481 3.497 3.461 3.513 3.528 3.496 3.533 3.450 3.516 3.476
3.512 3.550 3.441 3.541 3.569 3.531 3.468 3.564 3.522 3.520
3.505 3.523 3.475 3.470 3.457 3.536 3.528 3.477 3.536 3.491
3.510 3.461 3.431 3.502 3.491 3.506 3.439 3.513 3.496 3.539
3.469 3.481 3.515 3.535 3.460 3.575 3.488 3.515 3.484 3.482
3.517 3.483 3.467 3.467 3.502 3.471 3.516 3.474 3.500 3.466
;
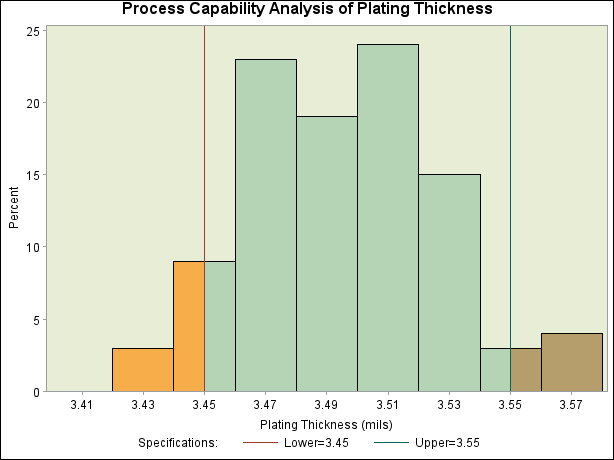
The following statements produce a histogram of the variable Thickness using traditional graphics whose default appearance is determined by the ODS style.
ods graphics off;
title 'Process Capability Analysis of Plating Thickness';
proc capability data=Trans noprint;
   spec lsl=3.45 usl=3.55 cleft cright;
   histogram Thickness;
run;
The SPEC statement LSL= and USL= options specify the lower specification limit (LSL) and upper specification limit (USL) for
Thickness. The CLEFT and CRIGHT options request that histogram bars (and portions of bars) below the LSL and above the USL be filled
with contrasting colors. Figure 3.1 shows the resulting histogram.
Figure 3.1: Traditional Graphics with Default Appearance Determined by ODS Style
The attributes determining the appearance of the graph elements—including text fonts and heights, line styles and thicknesses, and fill colors—all come from the ODS style associated with the output destination. In this case the HTMLBLUE style is in effect.
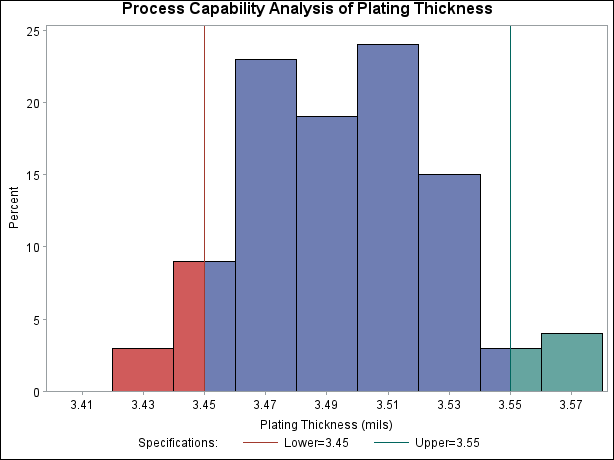
Prior to SAS 9.2, in order to fill histogram bars outside the specification limits with contrasting colors, it was necessary to specify CLEFT= and CRIGHT= colors explicitly. SAS/QC procedures now support options such as CLEFT and CRIGHT that enable optional graph features without explicitly specifying colors.
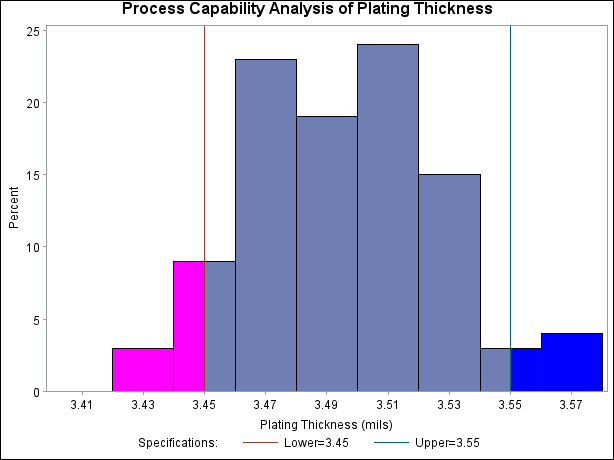
In SAS 9.2, you can still specify colors "on top of" the ODS style, as the following statements demonstrate:
proc capability data=Trans noprint;
   spec lsl=3.45 usl=3.55 cleft=magenta cright=blue;
   histogram Thickness;
run;
The colors explicitly specified with the CLEFT= and CRIGHT= options replace the CLEFT and CRIGHT colors used in Figure 3.1. The resulting histogram is shown in Figure 3.2.
Figure 3.2: Traditional Graphics Using ODS Style and Appearance Options
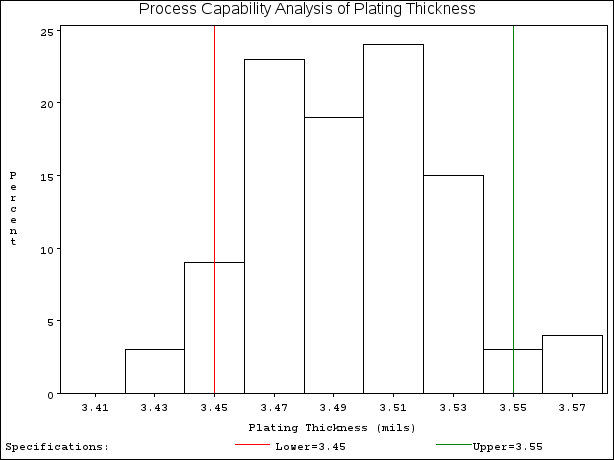
Graphical attributes, such as colors or fonts, specified with global graphics statements or procedure options take precedence over default attributes from the ODS style. To avoid using style-based defaults or to revert to the defaults used prior to SAS 9.2, you can specify the NOGSTYLE system option:
options nogstyle;
proc capability data=Trans noprint;
   spec lsl=3.45 usl=3.55;
   histogram Thickness;
run;
The appearance of the resulting histogram, shown in Figure 3.3, is very similar to that of a histogram produced by the same CAPABILITY procedure statements in SAS 9.1.
Figure 3.3: Traditional Graphics with NOGSTYLE
When you specify the NOGSTYLE option, traditional graphics output remains unaffected by ODS styles until the default behavior is restored with the GSTYLE option:
options gstyle;
proc capability data=Trans noprint;
   spec lsl=3.45 usl=3.55 cleft=CXf7AE4A cright=CXB59E6B;
   histogram Thickness / cframe = ywh
                         cfill  = CXB5D3B5;
run;
The preceding statements produce the histogram shown in Figure 3.4. Here, the default attributes provided by the HTMLBLUE style are overridden by the CLEFT=, CRIGHT=, CFRAME=, and CFILL= options.
Figure 3.4: Traditional Graphics Using ODS Style and Attribute Options