The SHEWHART Procedure
Note: See Displaying Multiple Sets of Control Limits in the SAS/QC Sample Library.
This section describes the use of the READPHASES= and READINDEXES= options for creating Shewhart charts that display distinct sets of control limits for multiple phases of observations. The term phase refers to a group of consecutive observations in the input data set. For example, the phases might correspond to the time periods during which a new process was brought into production and then put through successive changes.
To display phases, your input data must include a character variable named _PHASE_, whose length cannot exceed 48. (If your data set does not include a variable named _PHASE_, you can temporarily rename another character variable to _PHASE_, as illustrated in the statements in the section Displaying Stratification in Phases.) Each phase consists of a group of consecutive observations with the same value of _PHASE_.
To display distinct sets of predetermined control limits for the phases, you must provide the limits in a LIMITS= data set.
This data set must include a character variable named _INDEX_, whose length cannot exceed 48. This variable identifies the sets of control limits (observations) in the LIMITS= data set
that are to be associated with the phases. This data set must also include a number of other variables with reserved names
that begin and end with an underscore. The particular structure of a LIMITS= data set depends on the chart statement that
you are using; for details, see the sections titled "LIMITS= Data Set" in the sections for the various chart statements. In
addition to specifying a LIMITS= data set, you must also specify the READINDEXES= and READPHASES= options in the chart statement.
Note: To display a single set of predetermined control limits with multiple phases, simply specify a LIMITS= data set in the procedure statement. If
you are using SAS 6.09 or an earlier release, you must also specify the READLIMITS option. The control limits are read from
the first observation in the LIMITS= data for which the variable _VAR_ is equal to the name of the process and the variable _SUBGRP_ is equal to the name of the subgroup-variable. For an example, see Reading Preestablished Control Limits.
This section describes the combinations of the READINDEXES= and READPHASES= options that you can specify. The examples that
follow use the HISTORY= data set Flange listed in Figure 17.149 and the LIMITS= data set Flangelim listed in Figure 17.150. The data in Flange consist of means and ranges of flange width measurements for subgroups of size five. The observations are grouped into three
phases determined by the _PHASE_ values 'Production', 'Change 1', and 'Change 2'. Three sets of control limits are provided in Flangelim, corresponding to the _INDEX_ values 'Start', 'Production', and 'Change 1'.
Figure 17.149: Listing of the HISTORY= Data Set Flange
| Obs | _phase_ | Day | Sample | FlwidthX | FlwidthR | FlwidthN |
|---|---|---|---|---|---|---|
| 1 | Production | 08FEB90 | 6 | 0.97360 | 0.06247 | 5 |
| 2 | Production | 09FEB90 | 7 | 1.00486 | 0.11478 | 5 |
| 3 | Production | 10FEB90 | 8 | 1.00251 | 0.13537 | 5 |
| 4 | Production | 11FEB90 | 9 | 0.95509 | 0.08378 | 5 |
| 5 | Production | 12FEB90 | 10 | 1.00348 | 0.09993 | 5 |
| 6 | Production | 15FEB90 | 11 | 1.02566 | 0.06766 | 5 |
| 7 | Production | 16FEB90 | 12 | 0.97053 | 0.07608 | 5 |
| 8 | Production | 17FEB90 | 13 | 0.94713 | 0.10170 | 5 |
| 9 | Production | 18FEB90 | 14 | 1.00377 | 0.04875 | 5 |
| 10 | Production | 19FEB90 | 15 | 0.99604 | 0.08242 | 5 |
| 11 | Change 1 | 22FEB90 | 16 | 0.99218 | 0.09787 | 5 |
| 12 | Change 1 | 23FEB90 | 17 | 0.99526 | 0.02017 | 5 |
| 13 | Change 1 | 24FEB90 | 18 | 1.02235 | 0.10541 | 5 |
| 14 | Change 1 | 25FEB90 | 19 | 0.99950 | 0.11476 | 5 |
| 15 | Change 1 | 26FEB90 | 20 | 0.99271 | 0.05395 | 5 |
| 16 | Change 1 | 01MAR90 | 21 | 0.98695 | 0.03833 | 5 |
| 17 | Change 1 | 02MAR90 | 22 | 1.00969 | 0.06183 | 5 |
| 18 | Change 1 | 03MAR90 | 23 | 0.98791 | 0.05836 | 5 |
| 19 | Change 1 | 04MAR90 | 24 | 1.00170 | 0.05243 | 5 |
| 20 | Change 1 | 05MAR90 | 25 | 1.00412 | 0.04815 | 5 |
| 21 | Change 2 | 08MAR90 | 26 | 1.00261 | 0.05604 | 5 |
| 22 | Change 2 | 09MAR90 | 27 | 0.99553 | 0.02818 | 5 |
| 23 | Change 2 | 10MAR90 | 28 | 1.01463 | 0.05558 | 5 |
| 24 | Change 2 | 11MAR90 | 29 | 0.99812 | 0.03648 | 5 |
| 25 | Change 2 | 12MAR90 | 30 | 1.00047 | 0.04309 | 5 |
| 26 | Change 2 | 15MAR90 | 31 | 0.99714 | 0.03689 | 5 |
| 27 | Change 2 | 16MAR90 | 32 | 0.98642 | 0.04809 | 5 |
| 28 | Change 2 | 17MAR90 | 33 | 0.98891 | 0.07777 | 5 |
| 29 | Change 2 | 18MAR90 | 34 | 1.00087 | 0.06409 | 5 |
| 30 | Change 2 | 19MAR90 | 35 | 1.00863 | 0.02649 | 5 |
Figure 17.150: Listing of the LIMITS= Data Set Flangelim
| Obs | _index_ | _var_ | _subgrp_ | _type_ | _limitn_ | _alpha_ | _sigmas_ | _lclx_ | _mean_ | _uclx_ | _lclr_ | _r_ | _uclr_ | _stddev_ |
|---|---|---|---|---|---|---|---|---|---|---|---|---|---|---|
| 1 | Change 1 | FLWIDTH | SAMPLE | ESTIMATE | 5 | .0026998 | 3 | 0.96167 | 0.99924 | 1.03680 | 0 | 0.06513 | 0.13771 | 0.028000 |
| 2 | Production | FLWIDTH | SAMPLE | ESTIMATE | 5 | .0026998 | 3 | 0.93792 | 0.98827 | 1.03862 | 0 | 0.08729 | 0.18458 | 0.037530 |
| 3 | Start | FLWIDTH | SAMPLE | ESTIMATE | 5 | .0026998 | 3 | 0.87088 | 0.96803 | 1.06517 | 0 | 0.16842 | 0.35612 | 0.072409 |
For each of the READINDEXES= and READPHASES= options, you can specify a single value, a list of values, or the keyword ALL. You can also leave these options unspecified. Thus, there are 16 possible combinations of specifications for the two options, as explained by the following table and notes. The two most commonly encountered combinations are
-
reading a single set of limits for one or more phases (see Case 1)
-
reading a set of limits matched with a set of phases (see Case 4)
|
READPHASES= |
||||
|---|---|---|---|---|
|
READINDEXES= |
Single Value |
Multiple Values |
Keyword ALL |
Not Specified |
|
Single Value |
See Case 1 |
See Case 1 |
See Case 2 |
See Case 3 |
|
Multiple Values |
See Case 9 |
See Case 4 |
See Case 2 |
See Case 2 |
|
Keyword ALL |
See Case 5 |
See Case 5 |
See Case 6 |
See Case 6 |
|
Not Specified |
See Case 7 |
See Case 7 |
See Case 8 |
See Case 8 |
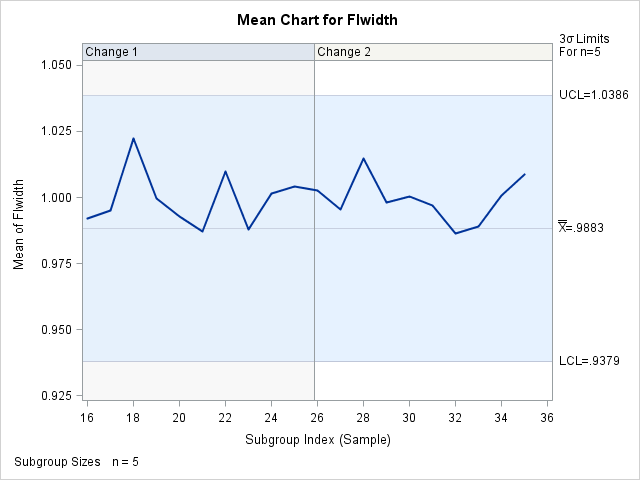
Case 1. READPHASES=value|value-list and READINDEXES=value
The only phases (groups of observations) read are those for which _PHASE_ equals one of the values specified with the READPHASES= option. The chart displays a single set of control limits given by the first observation in
the LIMITS= data set for which _INDEX_ is equal to the READINDEXES= value.
For example, the following statements create a chart for the phases 'Change 1' and 'Change 2', with control limits read from
the second observation in Flangelim. The chart is displayed in Figure 17.151.
ods graphics on;
proc shewhart history=Flange limits=Flangelim;
   xchart Flwidth*Sample /
      readphase = ('Change 1' 'Change 2')
      readindex = ('Production')
      phaseref
      phaselegend;
run;
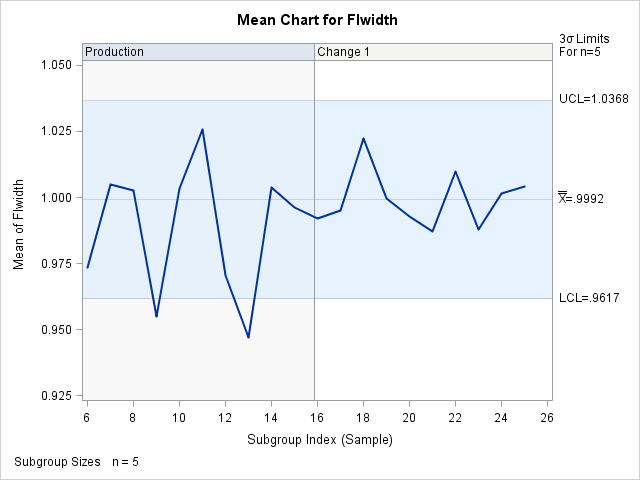
Case 2. READPHASES=ALL and READINDEXES=value|value-list or READPHASES= is omitted and READINDEXES=value-list
The only phases read are those for which _PHASE_ equals one of the values specified with the READINDEXES= option. The chart displays a different set of control limits for each phase, read from the
first observation in the LIMITS= data set for which _INDEX_ is equal to the corresponding value.
For example, the following statements create a chart for the phases 'Production' and 'Change 1' with control limits read from
the second and first observations in Flangelim, respectively. The chart is displayed in Figure 17.152.
proc shewhart history=Flange limits=Flangelim;
   xchart Flwidth*Sample /
      readphase = all
      readindex = ('Production' 'Change 1')
      phaseref
      phaselegend;
run;
If you wish to specify a single set of control limits to use with all the phases, use the READINDEXES= option without the READPHASES= option (see Case 3).

Case 3. READPHASES= is omitted and READINDEXES=value
All observations are read from the input data set. The chart displays a single set of control limits read from the first observation
in the LIMITS= data for which _INDEX_ equals the value.
Case 4. READPHASES=value-list and READINDEXES=value-list
The only phases read are those for which _PHASE_ equals one of the values specified with the READPHASES= option. The chart displays a different set of control limits for
each phase, given by the first observation in the LIMITS= data set for which _INDEX_ equals the READINDEXES=value. Control limits are matched with phases in the order listed.
For example, the following statements create a chart for the phases 'Production' and 'Change 1' with control limits read from
the first and second observations in Flangelim, respectively. The chart produced by these statements is identical to the chart in Figure 17.152.
proc shewhart history=Flange limits=Flangelim;
   xchart Flwidth*Sample /
      readphases  = ('Production' 'Change 1')
      readindexes = ('Production' 'Change 1')
      phaseref
      phaselegend;
run;
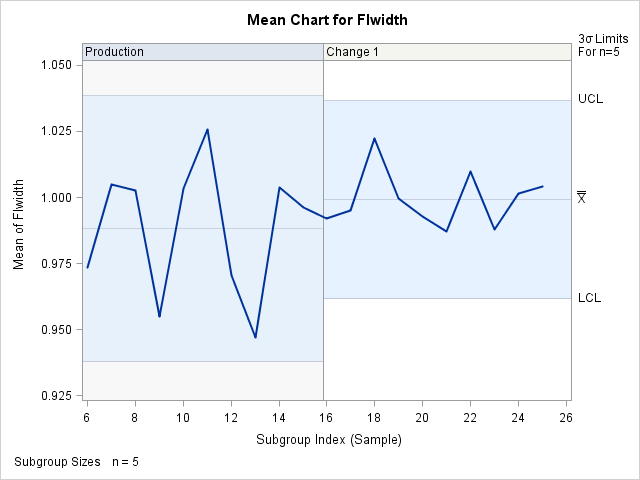
The order of the READINDEX=value-list is critical. For instance, the previous statements with READINDEXES=(’Change 1’ ’Production’) create the chart in Figure 17.153, in which the control limits are mismatched with the phases.
Case 5. READPHASES=value|value-list and READINDEXES=ALL
The only phases read are those for which _PHASE_ equals one of the values specified with the READPHASES= option. The chart displays a different set of control limits for each phase, read from the
first observation in the LIMITS= data set for which _INDEX_ equals the value corresponding to the phase.
For example, the following statements create a chart for the phases 'Production' and 'Change 1' with the control limits read
from the second and first observations in Flangelim, respectively:
proc shewhart history=Flange limits=Flangelim;
   xchart Flwidth*Sample /
      readphases  = ('Production' 'Change 1')
      readindexes = all
      phaseref
      phaselegend ;
run;
The chart is identical to the chart in Figure 17.152. In general, to read a set of phases with identically labeled control limits, you can specify the phases with either the READPHASES= or READINDEXES= option, and you can specify the keyword ALL with the other option.
Case 6. READPHASES=ALL and READINDEXES=ALL or READPHASES= is omitted and READINDEXES=ALL
All phases are read for which _PHASE_ is a value of _INDEX_ in the LIMITS= data set. The chart displays a different set of control limits for each phase, read from the first observation
in the LIMITS= data set for which _INDEX_ equals the value of _PHASE_.
For example, the following statements create a chart for the phases 'Production' and 'Change 1' with control limits read from
the second and first observations in Flangelim, respectively. These two phases are read because they are the only phases in Flange with matching _INDEX_ values in Flangelim. The chart is identical to that in Figure 17.152.
proc shewhart history=Flange limits=Flangelim;
   xchart Flwidth*Sample /
      readphase = all
      readindex = all
      phaseref
      phaselegend ;
run;
Note that an identical chart would be produced if you were to omit the READPHASES= option.
Case 7. READPHASES=value|value-list and READINDEXES= is omitted
The only phases read are those for which _PHASE_ equals one of the values specified with the READPHASES= option. The chart displays a single set of control limits read from the first observation
in the LIMITS= data set for which _VAR_ equals the process and _SUBGRP_ equals the name of the subgroup-variable specified in the chart statement.
For example, the following statements create a chart for the phases 'Production' and 'Change 1' with control limits read from
the first observation in Flangelim, because this is the first observation for which _VAR_ equals 'Flwidth' and _SUBGRP_ equals 'Sample'.
The chart is displayed in Figure 17.154.
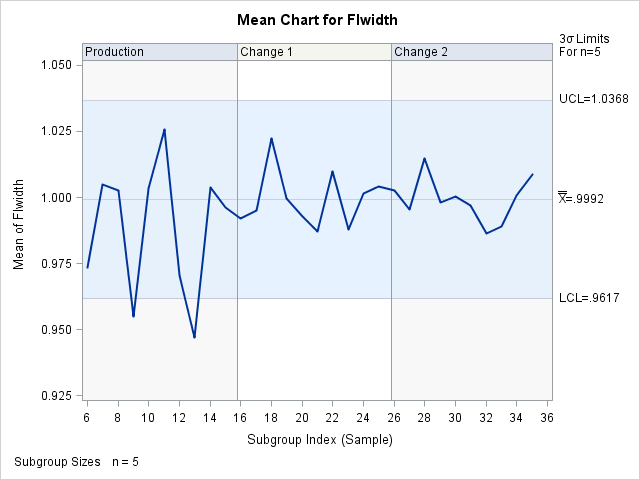
Case 8. READPHASES=ALL and READINDEXES= is omitted or READPHASES= is omitted and READINDEXES= is omitted
All observations are read from the input data set. The chart displays a single set of control limits read from the first observation
in the LIMITS= data set for which _VAR_ equals the process and _SUBGRP_ equals the name of the subgroup-variable specified in the chart statement.
For example, the following statements create a chart for all the phases in Flange with control limits read from the first observation in Flangelim, because this is the first observation for which _VAR_ equals 'FLWIDTH' and _SUBGRP_ equals 'SAMPLE':
The chart is shown in Figure 17.155. Note that an identical chart would be produced if you were to omit the READPHASES= option (except that the phase reference lines and phase legends would be omitted).
Case 9. READPHASES=value and READINDEXES=value-list
The procedure generates an error message.
The following tables summarize the various combinations of the READPHASES= and READINDEXES= options that you can specify.
Table 17.90: READINDEXES=index-value
|
READPHASES= |
Phases Displayed |
Control Limits Displayed |
|---|---|---|
|
phase-value |
|
|
|
phase-value list |
|
|
|
Keyword ALL |
|
|
|
Not Specified |
All phases |
|
Table 17.91: READINDEXES=index-value list
|
READPHASES= |
Phases Displayed |
Control Limits Displayed |
|---|---|---|
|
phase-value |
No chart displayed |
No chart displayed |
|
phase-value list |
|
|
|
Keyword ALL |
|
|
|
Not Specified |
|
|
Table 17.92: READINDEXES=ALL
|
READPHASES= |
Phases Displayed |
Control Limits Displayed |
|---|---|---|
|
phase-value |
|
|
|
phase-value list |
|
|
|
Keyword ALL |
|
|
|
Not Specified |
|
|
Table 17.93: READINDEXES= Not Specified
|
READPHASES= |
Phases Displayed |
Control Limits Displayed |
|---|---|---|
|
phase-value |
|
First LIMITS= observation for which |
|
phase-value list |
|
same as previous entry |
|
Keyword ALL |
All phases |
same as previous entry |
|
Not Specified |
All phases |
same as previous entry |