The SHEWHART Procedure
Note: See Stratifying Data with a Classification Variable in the SAS/QC Sample Library.
To display process data stratified into levels of a classification variable, specify the name of this variable after an equal sign (=) immediately following the subgroup-variable in the chart statement. The classification variable, referred to as the symbol-variable, must be a variable in the input data set (a DATA=, HISTORY=, or TABLE= data set). The subgroup summary statistics are classified into groups according to the levels of the symbol-variable and are identified on the chart with unique plotting symbols.
When you produce traditional graphics output, you can specify the symbols with SYMBOL statements. It is recommended that you
place the SYMBOL statements before the PROC SHEWHART statement. If you omit the SYMBOL statements, the procedure uses the
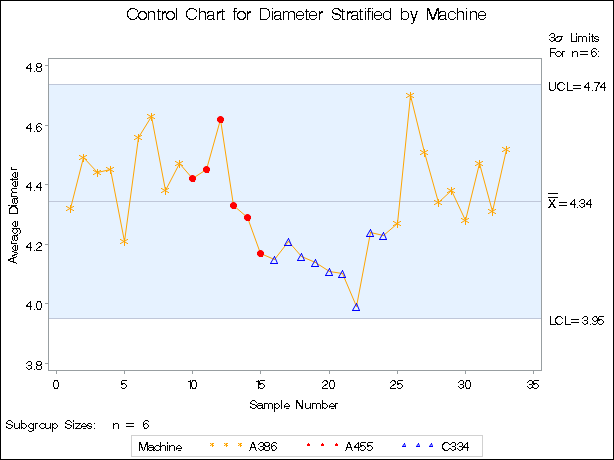
default symbol (+) for all levels of the symbol-variable but plots the points for each level in a distinct color. The following example illustrates the use of a symbol-variable to stratify the points on an ![]() chart according to the machine that produced the parts in each subgroup:
chart according to the machine that produced the parts in each subgroup:
ods graphics off;
symbol1 c=orange value=star      h=3.0 pct;
symbol2 c=red    value=dot       h=3.0 pct;
symbol3 c=blue   value=triangle  h=3.0 pct;
title 'Control Chart for Diameter Stratified by Machine';
proc shewhart history=Parts;
   xchart Diam*Sample=Machine / stddeviations
                                symbollegend = legend1;
   label Sample = 'Sample Number'
         DiamX  = 'Average Diameter' ;
   legend1 frame label=('Machine');
run;
The symbols are specified with the SYMBOL1, SYMBOL2, and SYMBOL3 statements. The SYMBOLLEGEND= option requests a customized
legend for the symbols. For more information about the LEGEND and SYMBOL statements, refer to
SAS/GRAPH: Reference. The ![]() chart, shown in Figure 17.143, reveals an effect due to
chart, shown in Figure 17.143, reveals an effect due to Machine. In particular, Machine C334 is associated with a run of parts whose diameters are systematically below average, suggesting
that this machine may require adjustment.
For line printer charts, you can use the SYMBOLCHARS= option to specify the characters that identify the stratification of the points. For details, see the entry for the SYMBOLCHARS= option in Dictionary of Options: SHEWHART Procedure.
In this example, Machine A386 is associated with two different blocks of observations that are identified with a common symbol. However, a symbol-variable is particularly useful for situations where the stratification is not necessarily chronological or associated with blocks of consecutive groups of observations.