The SHEWHART Procedure
You can also specify the position of the inset with coordinates: POSITION![]() . The coordinates can be given in axis percent units (the default) or in axis data units.
. The coordinates can be given in axis percent units (the default) or in axis data units.
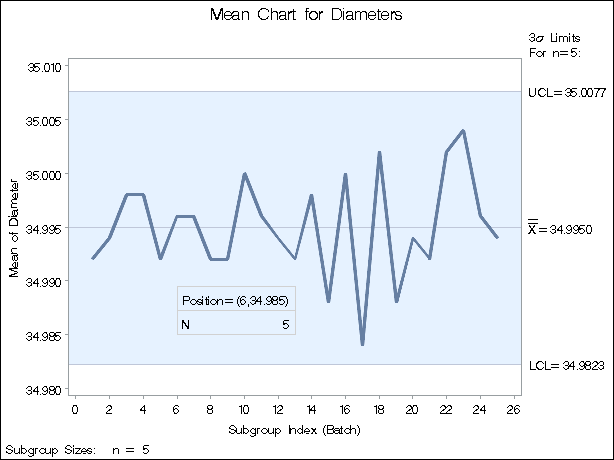
If you specify the DATA option immediately following the coordinates, the inset is positioned using axis data units. For example, the following statements place the bottom left corner of the inset at 6 on the horizontal axis and 34.985 on the vertical axis:
title 'Mean Chart for Diameters';
proc shewhart data=Wafers;
   xchart Diameter*Batch;
   inset n /
      header   = 'Position=(6,34.985)'
      position = (6,34.985) data;
run;
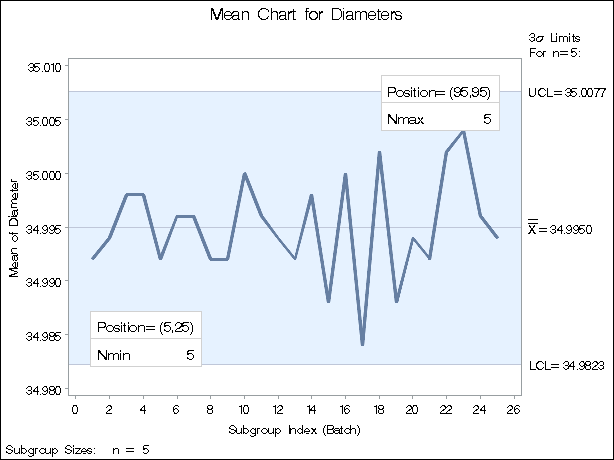
The control chart is displayed in Figure 17.128. By default, the specified coordinates determine the position of the bottom left corner of the inset. You can change this reference point with the REFPOINT= option, as in the next example.
If you do not use the DATA option, the inset is positioned using axis percent units. The coordinates of the bottom left corner
of the display are ![]() , while the upper right corner is
, while the upper right corner is ![]() . For example, the following statements create a
. For example, the following statements create a ![]() chart with two insets, both positioned using coordinates in axis percent units:
chart with two insets, both positioned using coordinates in axis percent units:
title 'Mean Chart for Diameters';
proc shewhart data=Wafers;
   xchart Diameter*Batch;
   inset nmin / position = (5,25)
                 header   = 'Position=(5,25)'
                 height   = 3
                 cfill    = blank
                 refpoint = tl;
   inset nmax / position = (95,95)
                 header   = 'Position=(95,95)'
                 height   = 3
                 cfill    = blank
                 refpoint = tr;
run;
The display is shown in Figure 17.129. Notice that the REFPOINT= option is used to determine which corner of the inset is to be placed at the coordinates specified with the POSITION= option. The first inset has REFPOINT=TL, so the top left corner of the inset is positioned 5% of the way across the horizontal axis and 25% of the way up the vertical axis. The second inset has REFPOINT=TR, so the top right corner of the inset is positioned 95% of the way across the horizontal axis and 95% of the way up the vertical axis. Note also that coordinates in axis percent units must be between 0 and 100.

