You can specify a label for the vertical axis of a primary chart by using a LABEL statement to assign the label to a particular variable in the input data set. The type of input data set, the chart statement, and the process specified in the chart statement determine which variable to use in the LABEL statement.
-
If the input data set is a DATA= data set, assign the label to the process variable (process) specified in the chart statement.
-
If the input data set is a HISTORY= data set, assign the label to the variable specified in the chart statement whose name begins with the prefix process and ends with the appropriate suffix given by the following list:
Chart Statement
Suffix
BOXCHART with CONTROLSTAT=MEAN
X
BOXCHART with CONTROLSTAT=MEDIAN
M
CCHART
U
IRCHART
none
MCHART
M
MRCHART
M
NPCHART
P
PCHART
P
RCHART
R
SCHART
S
UCHART
U
XCHART
X
XRCHART
X
XSCHART
X
If the prefix process consists of 32 characters, shorten the prefix to its first 16 characters and last 15 characters before adding the suffix.
-
If the input data set is a TABLE= data set, assign the label to the predefined variable given by the following table:
Chart Statement
Variable
BOXCHART with CONTROLSTAT=MEAN
_SUBX_BOXCHART with CONTROLSTAT=MEDIAN
_SUBMED_CCHART
_SUBC_IRCHART
_SUBI_MCHART
_SUBMED_MRCHART
_SUBMED_NPCHART
_SUBNP_PCHART
_SUBP_RCHART
_SUBR_SCHART
_SUBS_UCHART
_SUBU_XCHART
_SUBX_XRCHART
_SUBX_XSCHART
_SUBX_
If the chart statement produces primary and secondary charts, as in the case of the XSCHART statement, you can break the label into two parts by including a split character in the label. The part before the split character labels the vertical axis of the primary chart, and the part after the split character labels the vertical axis of the secondary chart. To specify the split character, use the SPLIT= option in the chart statement.
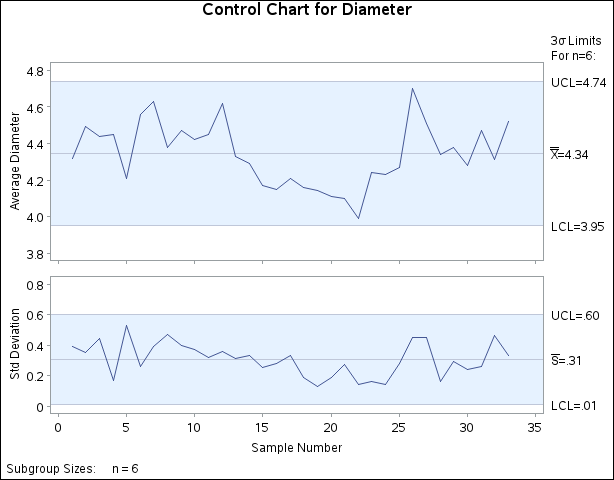
For example, the following statements redisplay the ![]() and s charts in Figure 17.171 with specified labels for the horizontal and vertical axes:
and s charts in Figure 17.171 with specified labels for the horizontal and vertical axes:
symbol v=none w=1;
title 'Control Chart for Diameter';
proc shewhart history=Parts;
   xschart Diam*Sample / split   = '/';
   label Sample = 'Sample Number'
         DiamX  = 'Average Diameter/Std Deviation';
run;
The charts are displayed in Figure 17.172. Because the input data set Parts is a HISTORY= data set, the vertical axes are labeled by assigning a label to the subgroup mean variable DiamX (that is, the process Diam with the suffix X).[40] Assigning a label to Diam would result in an error message since Diam is interpreted as a prefix rather than a SAS variable.
If the input data set were a DATA= data set rather than a HISTORY= data set, you would associate the label with the variable
Diam. If the input data set were a TABLE= data set, you would associate the label with the variable _SUBX_.
For another illustration, see Example 17.17.
[40] If the process were Diameter rather than Diam, the label would be assigned to the variable DiameterX.