In the manufacture of silicon wafers, batches of five wafers are sampled, and their diameters are measured in millimeters.
The following statements create a SAS data set named Wafers, which contains the measurements for 25 batches:
data Wafers;
   input Batch @;
   do i=1 to 5;
      input Diameter @;
      output;
   end;
   drop i;
   datalines;
 1  35.00 34.99 34.99 34.98 35.00
 2  35.01 34.99 34.99 34.98 35.00
 3  34.99 35.00 35.00 35.00 35.00
 4  35.01 35.00 34.99 34.99 35.00
 5  35.00 34.99 34.98 34.99 35.00
 6  34.99 34.99 35.00 35.00 35.00
 7  35.01 34.98 35.00 35.00 34.99
 8  35.00 35.00 34.99 34.98 34.99
 9  34.99 34.98 34.98 35.01 35.00
10  34.99 35.00 35.01 34.99 35.01
11  35.01 35.00 35.00 34.98 34.99
12  34.99 34.99 35.00 34.98 35.01
13  35.01 34.99 34.98 34.99 34.99
14  35.00 35.00 34.99 35.01 34.99
15  34.98 34.99 34.99 34.98 35.00
16  34.99 35.00 35.00 35.01 35.00
17  34.98 34.98 34.99 34.99 34.98
18  35.01 35.02 35.00 34.98 35.00
19  34.99 34.98 35.00 34.99 34.98
20  34.99 35.00 35.00 34.99 34.99
21  35.00 34.99 34.99 34.98 35.00
22  35.00 35.00 35.01 35.00 35.00
23  35.02 35.00 34.98 35.02 35.00
24  35.00 35.00 34.99 35.01 34.98
25  34.99 34.99 34.99 35.00 35.00
;
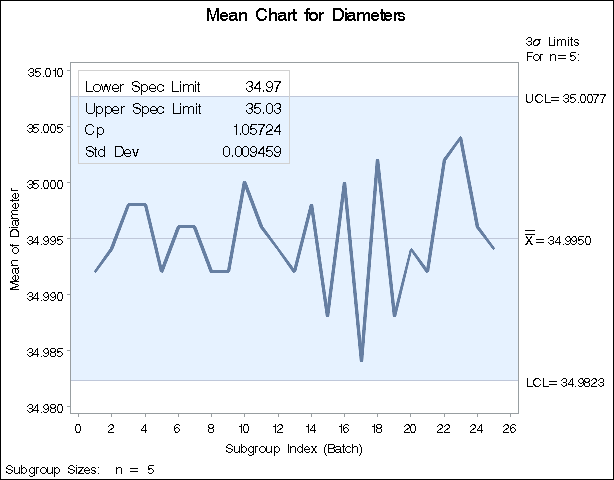
The following statements generate an ![]() chart from the
chart from the Wafers data. Lower and upper specification limits for wafer diameters are given and the process capability index ![]() is computed. An INSET statement is used to display the specification limits, the computed value of
is computed. An INSET statement is used to display the specification limits, the computed value of ![]() and the process standard deviation on the chart:
and the process standard deviation on the chart:
ods graphics off;
title 'Mean Chart for Diameters';
proc shewhart data=Wafers;
   xchart Diameter*Batch /
      lsl = 34.97
      usl = 35.03;
   inset lsl usl cp stddev /
      height = 3;
run;
The resulting ![]() chart is displayed in Figure 17.121. The INSET statement immediately follows the chart statement that creates the graphical display (in this case, the XCHART
statement). Specify the keywords for inset statistics (such as LSL, USL, CP and STDDEV) immediately after the word INSET.
The inset statistics appear in the order in which you specify the keywords. The HEIGHT= option on the INSET statement specifies
the text height used to display the statistics in the inset.
chart is displayed in Figure 17.121. The INSET statement immediately follows the chart statement that creates the graphical display (in this case, the XCHART
statement). Specify the keywords for inset statistics (such as LSL, USL, CP and STDDEV) immediately after the word INSET.
The inset statistics appear in the order in which you specify the keywords. The HEIGHT= option on the INSET statement specifies
the text height used to display the statistics in the inset.
A complete list of keywords that you can use with the INSET statement is provided in Summary of INSET Keywords. Note that the set of keywords available for a particular display depends on both the plot statement that precedes the INSET statement and the options that you specify in the plot statement.
The following examples illustrate options commonly used for enhancing the appearance of an inset.