This chapter provides an overview of the SAS/QC procedures that perform multivariate process monitoring. They are the MVPMODEL, MVPMONITOR, and MVPDIAGNOSE procedures, referred to collectively as the MVP procedures. The MVP procedures are used to monitor multivariate process variation over time in order to determine whether a process is stable, to detect changes in a stable process, and to investigate causes of unusual variation.
The MVPMODEL procedure builds a principal component model from multivariate process data. It uses principal component analysis
(PCA) techniques that evolved in the field of chemometrics for monitoring hundreds or even thousands of correlated process
variables; see Kourti and MacGregor (1995, 1996) for an introduction. A principal component model reduces the dimensionality of the data by projecting the process measurements
to a low-dimensional subspace that is defined by a small number of principal components. This subspace is known as the model hyperplane. PROC MVPMODEL computes ![]() and squared prediction error (SPE) statistics based on these principal components. See Chapter 12: The MVPMODEL Procedure, for details.
and squared prediction error (SPE) statistics based on these principal components. See Chapter 12: The MVPMODEL Procedure, for details.
The principal component model and the computed statistics that PROC MVPMODEL produces serve as input to the MVPMONITOR and MVPDIAGNOSE procedures.
The MVPMONITOR procedure creates multivariate control charts of the ![]() and SPE statistics. These control charts are used to monitor and categorize variation in the process. Multivariate control
charts can detect unusual variation that is not uncovered by individually monitoring the variables with univariate control
charts, such as Shewhart charts. See Chapter 13: The MVPMONITOR Procedure, for details.
and SPE statistics. These control charts are used to monitor and categorize variation in the process. Multivariate control
charts can detect unusual variation that is not uncovered by individually monitoring the variables with univariate control
charts, such as Shewhart charts. See Chapter 13: The MVPMONITOR Procedure, for details.
The MVPDIAGNOSE procedure produces score plots and contribution plots that can be used to investigate the unusual variation.
A score plot is a scatter plot of scores that are associated with a pair of principal components for the multivariate process
data. A contribution plot shows the contributions of the process variables to the ![]() or SPE statistic for a single observation. Both types of plots can be useful in understanding the unusual variation in the
process. See Chapter 11: The MVPDIAGNOSE Procedure, for details.
or SPE statistic for a single observation. Both types of plots can be useful in understanding the unusual variation in the
process. See Chapter 11: The MVPDIAGNOSE Procedure, for details.
Figure 10.1 shows the MVP procedures and their various inputs and outputs.
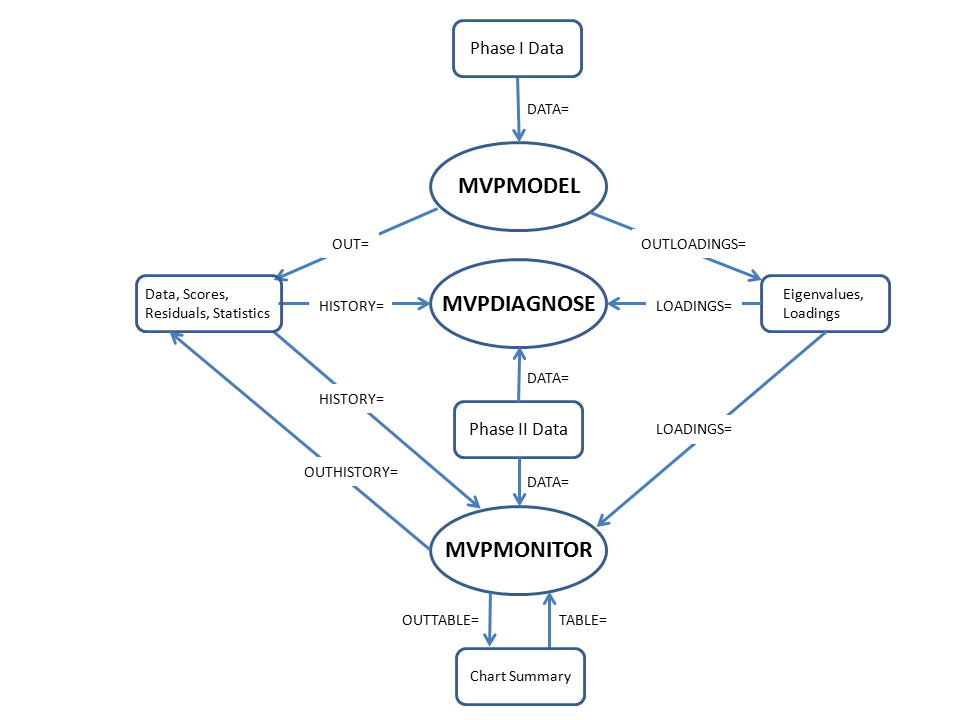
The MVP procedures are represented by ovals. Input and output data sets are represented by rounded rectangles and labeled with brief descriptions of their contents. The arrows between procedures and data sets are labeled with the names of the procedure options that are used to specify the data sets.
The distinction between the Phase I and Phase II data shown in Figure 10.1 is discussed in the next section.