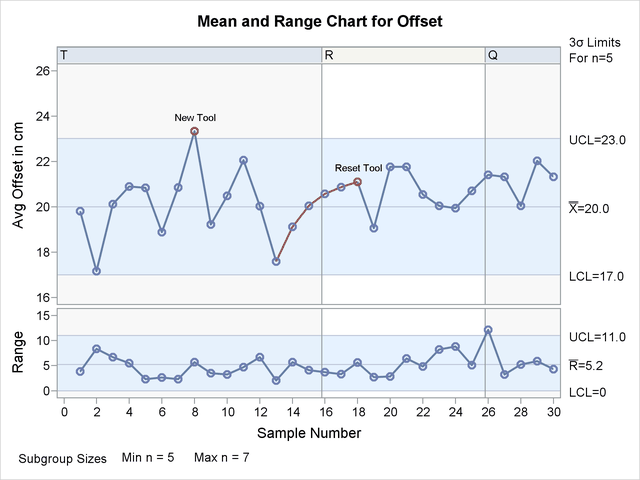
See SHWTSC1 in the SAS/QC Sample LibraryThe data set Assembly includes a variable named System, which indicates the manufacturing system used to produce each assembly. As shown by the following statements, this variable
can be temporarily renamed and read as the variable _PHASE_ to create a control chart that displays the phases (groups of consecutive subgroups) for which System is equal to 'T', 'R', and 'Q':
ods graphics on;
title 'Manufacturing Systems Used in Assembly';
proc shewhart
   history=Assembly (rename=(System=_phase_));
   xrchart Offset * Sample /
      mu0         = 20
      sigma0      = 2.24
      limitn      = 5
      alln
      tests       = 1 to 4
      testlabel   = ( comment )
      readphases  = ('T' 'R' 'Q')
      phaselegend
      phaseref
      vaxis       = 16 to 26 by 2
      split       = '/'
      markers;
   label OffsetX = 'Avg Offset in cm/Range';
run;
The chart is shown in Figure 17.183.
Note that a single set of fixed 3![]() limits is displayed for all three phases because LIMITN=5 and ALLN are specified. Consequently, the tests requested with
the TESTS= option are applied independently of the phases. In general, however, it is possible to display distinct sets of
control limits for different phases, and in such situations, the tests are not applied independently of phases, as discussed
in the next example.
limits is displayed for all three phases because LIMITN=5 and ALLN are specified. Consequently, the tests requested with
the TESTS= option are applied independently of the phases. In general, however, it is possible to display distinct sets of
control limits for different phases, and in such situations, the tests are not applied independently of phases, as discussed
in the next example.
