See SHWWHR in the SAS/QC Sample LibraryThe following statements create a data set named BOTTLES that records the number of cracked bottles encountered each day during two months (January and February) of a soft drink bottling operation:
data Bottles;
   informat Day date7.;
   format Day date7.;
   nBottles = 3000;
   input Day nCracks @@;
   datalines;
04JAN94  61  05JAN94  56  06JAN94  71  07JAN94  56
10JAN94  51  11JAN94  64  12JAN94  71  13JAN94  91
14JAN94  98  17JAN94  68  18JAN94  63  19JAN94  60
20JAN94  58  21JAN94  55  24JAN94  78  25JAN94  47
26JAN94  54  27JAN94  69  28JAN94  73  31JAN94  66
01FEB94  57  02FEB94  55  03FEB94  63  04FEB94  50
07FEB94  69  08FEB94  54  09FEB94  64  10FEB94  66
11FEB94  70  14FEB94  49  15FEB94  57  16FEB94  56
17FEB94  59  18FEB94  66  21FEB94  60  22FEB94  58
23FEB94  67  24FEB94  60  25FEB94  62  28FEB94  48
;
The variable nBottles contains the number of bottles sampled each day, and the variable nCracks contains the number of cracked bottles in each sample.
The following statements create a p chart for the number of cracked bottles based on the January production:
symbol h=3.0 pct;
title 'Preliminary Analysis of January Production';
proc shewhart data=Bottles;
   where Day <= '31JAN94'D;
   pchart nCracks * Day / subgroupn = nBottles
                          nohlabel
                          nolegend
                          outlimits = mylim;
   label nCracks = 'Proportion With Cracks';
run;
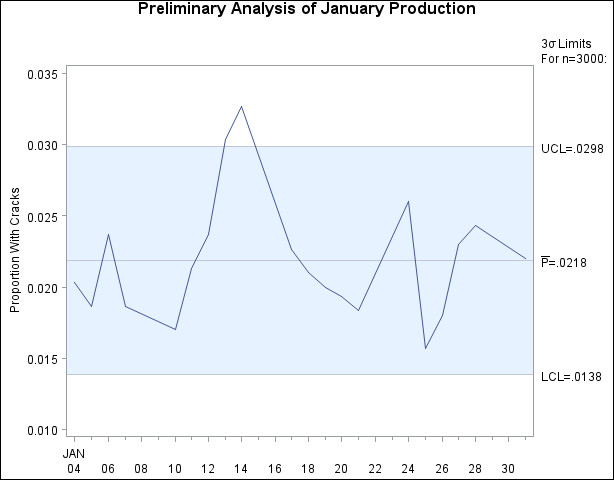
The chart is shown in Figure 17.173. The WHERE statement restricts the observations read from BOTTLES so that the control limits are estimated from the January data, and only the January data are displayed on the chart. For details concerning the WHERE statement, refer to SAS Statements: Reference.
In Figure 17.173, a special cause of variation is signaled by the proportions for January 13 and January 14, which exceed the upper control limit. Since the cause, an improper machine setting, was corrected, it is appropriate to recompute the control limits by excluding the data for these two days. Again, this can be done with a WHERE statement, as follows:
title 'Final Analysis of January Production';
proc shewhart data=Bottles;
   where ( Day <= '31JAN94'D ) &
         ( Day ne '13JAN94'D ) &
         ( Day ne '14JAN94'D )   ;
   pchart nCracks * Day / subgroupn = nBottles
                          nohlabel
                          nolegend
                          outlimits = Janlim;
   label nCracks = 'Proportion With Cracks';
run;
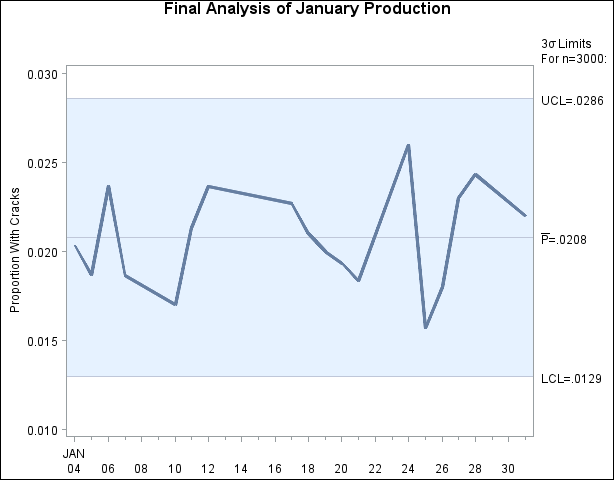
The chart is shown in Figure 17.174.
The data set JANLIM, which saves the control limits, is listed in Figure 17.175.
Figure 17.175: Listing of the LIMITS= Data Set JANLIM
| Final Analysis of January Production |
| _VAR_ | _SUBGRP_ | _TYPE_ | _LIMITN_ | _ALPHA_ | _SIGMAS_ | _LCLP_ | _P_ | _UCLP_ |
|---|---|---|---|---|---|---|---|---|
| nCracks | Day | ESTIMATE | 3000 | .003072976 | 3 | 0.012950 | 0.020759 | 0.028569 |
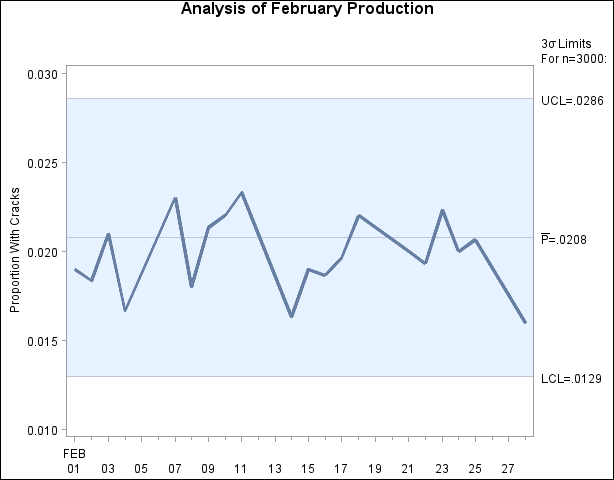
Now, the control limits based on the January data are to be applied to the February data. Again, this can be done with a WHERE statement, as follows:[94]
title 'Analysis of February Production';
proc shewhart data=Bottles limits=Janlim;
   where Day > '31JAN94'D;
   pchart nCracks * Day / subgroupn = nBottles
                          nolegend
                          nohlabel;
   label nCracks = 'Proportion With Cracks';
run;
The chart is shown in Figure 17.176.
[94] In SAS 6.09 and in earlier releases, it is also necessary to specify the READLIMITS option to read control limits from a LIMITS= data set.


