See SHWPHSE in the SAS/QC Sample LibraryThe preceding section describes the use of block-variables to display blocks of consecutive observations that correspond to changes in factors such as machines, shifts, and raw materials.
This section describes the use of a _PHASE_ variable to display phases of consecutive observations (as in Figure 17.147). Although the terms block and phase have similar meanings, there are differences in the two methods:
-
You can provide only one
_PHASE_variable, whereas you can specify multiple block-variables. -
You can display distinct control limits for each phase (see Displaying Multiple Sets of Control Limits) but not for each block.
-
Different sets of graphical options are available for identifying blocks and phases.
To display phases, your input data set must include a character variable named _PHASE_ of length 48 or less, and you must specify the READPHASES= option in the chart statement. (If your data set does not include
a variable named _PHASE_, you can temporarily rename another character variable to _PHASE_, as illustrated by the following statements.) The procedure classifies the data into phases (groups of consecutive observations
with the same value of _PHASE_) and reads only those observations whose _PHASE_ value matches one of the values specified with the READPHASES= option.
You can identify and highlight the phases with various options, as illustrated by the following statements, which produce
the chart shown in Figure 17.147. The PHASELEGEND option displays a legend with the _PHASE_ values, and the CPHASELEG= option specifies the color of the legend text. The PHASEREF option delineates the phases with
vertical reference lines. The CFRAME= option fills the framed areas for the phases with different colors.
title 'Control Chart for Diameter Stratified by Machine';
proc shewhart history=Parts(rename=(Machine=_phase_));
   xchart Diam*Sample /
      stddeviations
      readphases = ('A386' 'A455' 'C334' 'A386')
      cframe     = ( vibg   ywh    ligr   vibg )
      phaselegend
      cphaseleg  = black
      phaseref
      nolegend;
   label  Sample = 'Sample Number'
          DiamX  = 'Average Diameter';
run;
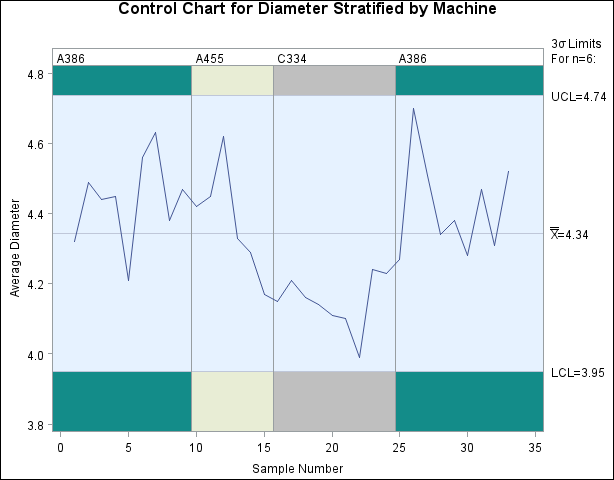
Note that the data set Parts does not contain a variable named _PHASE_, so the variable Machine is renamed as _PHASE_ for the duration of the procedure step.
The observations read from Parts are those whose value of Machine matches one of the values listed with the READPHASES= option in that order. Here, the value 'A386' is listed twice; consequently,
both groups of observations for which Machine equals 'A386' are read.
In this example, the input data set contains a single observation for each subgroup. If your input data set is a DATA= data
set that contains multiple observations with the same value of the subgroup-variable, the value of _PHASE_ must be the same for all observations with the same value of the subgroup-variable. Thus, in general, subgroups must be nested within phases.
Recall that the horizontal axis scale is determined by the subgroup-variable (see Subgroup Variables). If your subgroup-variable is numeric, this scale is continuous; consequently, you should select phases that are reasonably contiguous in order to avoid large empty gaps in your chart. For instance, if you were to specify
readphases = ('A386' 'A455' 'A386')
in the preceding XCHART statement, there would be a gap between the 15th and 25th points (these points would be connected unless you specified the PHASEBREAK option). You can avoid gaps by specifying a character subgroup-variable[91] for which a discrete horizontal axis scale will be displayed.
Note that the values listed in the READPHASES= option must be listed in the same order as they occur in the input data set.
Thus, in order to display all the observations in the data set Parts, 'A386' must be listed as both the first and last value. An alternative method for selecting all the phases from your input
data is to specify READPHASES=ALL, as described in the next section.
The control limits shown in Figure 17.147 are computed from the data and are, therefore, the same across all phases. More generally, you can display a distinct set of control limits for each phase. To do so, you must provide the control limits in a LIMITS= data set and specify the READINDEXES= option in addition to the READPHASES= option, as described in the next section.
[91] You can use the PUT function in a DATA step to create a character subgroup-variable from a numeric subgroup-variable.