See PARETO2 in the SAS/QC Sample LibraryUnlike the previous examples, some applications involve too many categories to display on a chart. The solution presented here is to create a restricted Pareto chart that displays only the most frequently occurring categories.
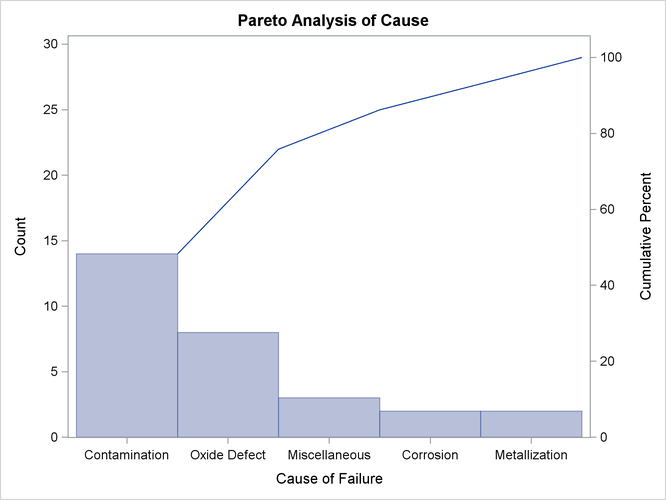
The following statements create a Pareto chart for the five most frequently occurring levels of Cause in the data set Failure2, which is listed in Figure 15.8:
ods graphics on;
proc pareto data=Failure2;
   vbar Cause / freq     = Count
                scale    = count
                maxncat  = 5;
run;
The ODS GRAPHICS ON statement specified before the PROC PARETO statement enables ODS Graphics, so the Pareto chart is created using ODS Graphics instead of traditional graphics.
The MAXNCAT= option specifies the number of categories to be displayed. The chart, shown in Figure 15.10, does not display the categories Doping and Silicon Defect.
You can also display the most frequently occurring categories and merge the remaining categories into a single other category that is represented by a bar. You can specify the name for the new category with the OTHER= option. If, in addition, you specify the name with the LAST= option, the category is positioned at the far right of the chart. The following statements illustrate both options:
ods graphics off;
title 'IC Manufacturing Problems';
proc pareto data=Failure2;
   vbar Cause / freq       = Count
                scale      = count
                maxncat    = 5
                other      = 'Others'
                last       = 'Others';
run;
The chart is shown in Figure 15.11.
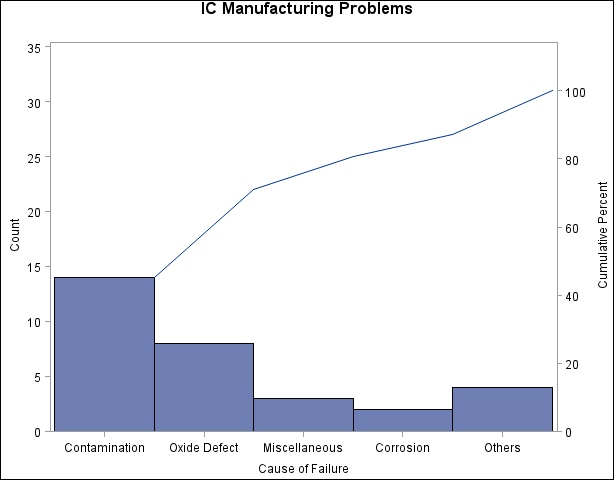
The number of categories displayed is five, which is the number specified with the MAXNCAT= option. The first four categories
are the four most frequently occurring problems in Failure2, and the fifth category merges the remaining problems.
Note that Corrosion and Metallization both have a frequency of two. When the MAXNCAT= option is applied to categories with tied frequencies, the procedure breaks the tie by using the order of the formatted values. Thus Corrosion is displayed, whereas Metallization is merged into the Other category. The MAXNCAT= and related options are described in Restricted Pareto Charts.