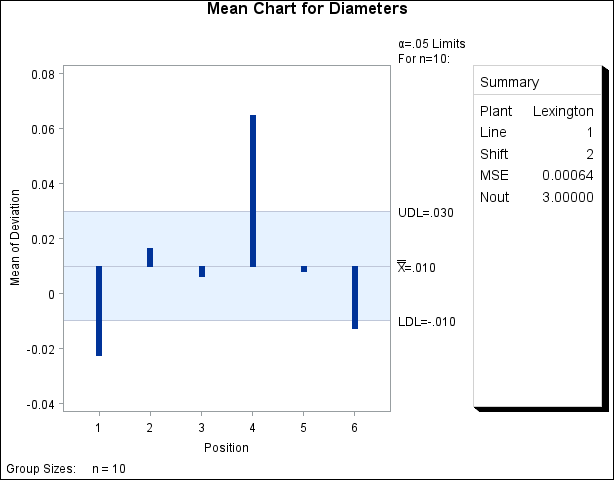
See ANMIN3 in the SAS/QC Sample LibraryIn the previous examples, the insets are displayed in the upper left corners of the plots, the default position for insets added to ANOM charts. You can control the inset position with the POSITION= option. In addition, you can display a header at the top of the inset with the HEADER= option. The following statements create a data set to be used with the INSET DATA= keyword and the chart shown in Figure 4.30:
data Location;
   length _LABEL_ $ 10 _VALUE_ $ 12;
   input _LABEL_ _VALUE_ &;
   datalines;
Plant     Lexington
Line      1
Shift     2
;
ods graphics off;
title 'Mean Chart for Diameters';
proc anom data=LabelDeviations;
   xchart Deviation*Position;
   inset data=Location mse nout /
      format   = 8.5
      position = rm
      cshadow  = black
      height   = 3
      header   = 'Summary';
run;
The header (in this case, Summary) can be up to 40 characters. POSITION=RM is specified to position the inset in the right margin. For more information about positioning, see Details: INSET Statement. The CSHADOW= option is used to display a drop shadow on this inset. The options, such as HEADER=, POSITION=, and CSHADOW=, are specified after the slash (/) in the INSET statement. For more details on INSET statement options, see Dictionary of Options.
Note that the contents of the data set Location appear before other statistics in the inset. The position of the DATA= keyword in the keyword list determines the position
of the data set’s contents in the inset. The FORMAT= option applies format 8.5 to the statistics listed in the INSET statement.
Note that the format does not apply to the values from the Location data set. You can associate a format with the _VALUE_ variable in the data set to format those values.