Procedures for Basic Quality Problem Solving
|
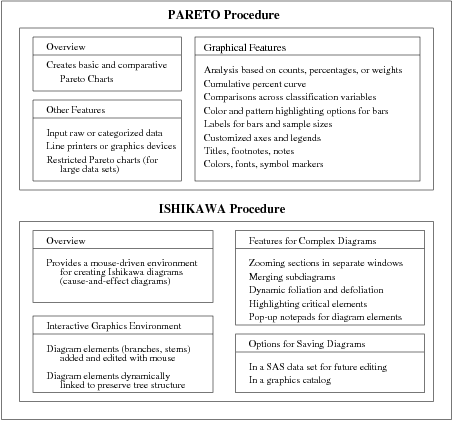
The PARETO procedure creates charts that display the relative frequency of problems in a process or operation. The ISHIKAWA procedure creates a cause-and-effect or fishbone diagram, which displays factors that affect a quality characteristic or problem. |
Figure 2.7
Overview of Quality Problem-Solving Procedures

