| The SHEWHART Procedure |
Methods for Estimating the Standard Deviation
When control limits are computed from the input data, three methods (referred to as default, MVLUE, and RMSDF) are available for estimating the process standard deviation  . The method depends on whether you specify the STDDEVIATIONS option. If you specify this option, is estimated using subgroup standard deviations; otherwise, is estimated using subgroup ranges.
For an illustration of the methods, see Example 13.35.
Default Method Based on Subgroup Ranges
If you do not specify the STDDEVIATIONS option, the default estimate for is
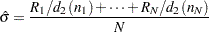 |
where  is the number of subgroups for which
  , and
, and  is the sample range of the observations
  , . . . ,
 in the
  th subgroup.
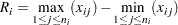 |
A subgroup range  is included in the calculation only if
  . The unbiasing factor
  is defined so that, if the observations are normally distributed, the expected value of is
  . Thus,
  is the unweighted average of unbiased estimates of . This method is described in the American Society for Testing and Materials (1976).
Default Method Based on Subgroup Standard Deviations
If you specify the STDDEVIATIONS option, the default estimate for is
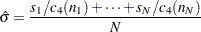 |
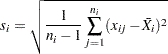
where is the number of subgroups for which ,  is the sample standard deviation of the th subgroup
 |
and
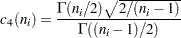 |
Here  denotes the gamma function, and
  denotes the th subgroup mean. A subgroup standard deviation is included in the calculation only if . If the observations are normally distributed, the expected value of is
  . Thus, is the unweighted average of unbiased estimates of . This method is described in the American Society for Testing and Materials (1976).
MVLUE Method Based on Subgroup Ranges
If you do not specify the STDDEVIATIONS option and you specify SMETHOD=MVLUE, a minimum variance linear unbiased estimate (MVLUE) is computed for . Refer to Burr (1969, 1976) and Nelson (1989, 1994). The MVLUE is a weighted average of unbiased estimates of of the form  , and it is computed as
 |
where
 |
A subgroup range is included in the calculation only if , and is the number of subgroups for which  . The unbiasing factor
  is defined so that, if the observations are normally distributed, the expected value of
  is
is  . The MVLUE assigns greater weight to estimates of from subgroups with larger sample sizes, and it is intended for situations where the subgroup sample sizes vary. If the subgroup sample sizes are constant, the MVLUE reduces to the default estimate.
MVLUE Method Based on Subgroup Standard Deviations
If you specify the STDDEVIATIONS option and SMETHOD=MVLUE, a minimum variance linear unbiased estimate (MVLUE) is computed for . Refer to Burr (1969, 1976) and Nelson (1989, 1994). This estimate is a weighted average of unbiased estimates of of the form  , and it is computed as
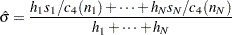 |
where
 |
A subgroup standard deviation  is included in the calculation only if , and is the number of subgroups for which . The MVLUE assigns greater weight to estimates of from subgroups with larger sample sizes, and it is intended for situations where the subgroup sample sizes vary. If the subgroup sample sizes are constant, the MVLUE reduces to the default estimate.
RMSDF Method Based on Subgroup Standard Deviations
If you specify the STDDEVIATIONS option and SMETHOD=RMSDF, a weighted root-mean-square estimate is computed for .
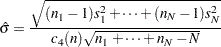 |
The weights are the degrees of freedom  . A subgroup standard deviation is included in the calculation only if , and is the number of subgroups for which .
If the unknown standard deviation is constant across subgroups, the root-mean-square estimate is more efficient than the minimum variance linear unbiased estimate. However, in process control applications, it is generally not assumed that is constant, and if varies across subgroups, the root-mean-square estimate tends to be more inflated than the MVLUE.
Default Method Based on Individual Measurements
When each subgroup sample contains a single observation ( ), the process standard deviation is estimated as
  , where
  is the average of the moving ranges of consecutive measurements taken in pairs. This is the method used to estimate for individual measurements and moving range charts. See Methods for Estimating the Standard Deviation.
Copyright © SAS Institute, Inc. All Rights Reserved.