| The SHEWHART Procedure |
Example 13.3 Creating Notched Box-and-Whisker Plots
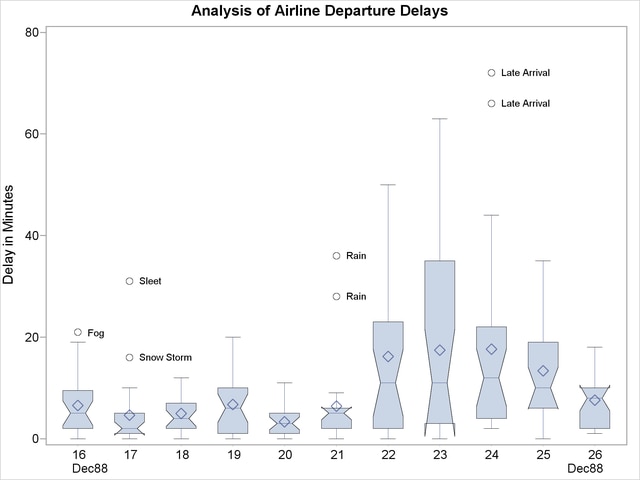
[See SHWBOX4 in the SAS/QC Sample Library]The following statements use the flight delay data of Example 13.1 to illustrate how to create side-by-side box-and-whisker plots with notches:
title 'Analysis of Airline Departure Delays';
ods graphics on;
proc shewhart data=Times limits=Timelim ;
   boxchart Delay * Day /
      boxstyle = schematicid
      odstitle = title
      nolimits
      nohlabel
      nolegend
      notches;
   id Reason;
   label Delay = 'Delay in Minutes';
run;
The control limits are suppressed with the NOLIMITS option. The notches, requested with the NOTCHES option, measure the significance of the difference between two medians. The medians are significantly different at approximately the 95% level if the notches do not overlap. For details, see the entry for NOTCHES in Dictionary of Options
Output 13.3.1
Notched Side-by-Side Box-and-Whisker Plots
Copyright © SAS Institute, Inc. All Rights Reserved.