| Functions |
| D2 Function |
computes the expected value of the sample range.
Syntax
D2
where  is the sample size, with
  .
.
Description
The D2 function returns the expected value of the sample range of independent, normally distributed random variables with the same mean and a standard deviation of 1. This expected value is referred to as the control chart constant  . The values returned by the D2 function are accurate to ten decimal places.
The value can be expressed as
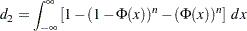 |
where  is the standard normal cumulative distribution function. Refer to Tippett (1925). In other chapters, is written as
  to emphasize the dependence on .
In the SHEWHART procedure, is used to calculate control limits for  charts, and it is used in the estimation of the process standard deviation based on subgroup ranges. Also refer to the American Society for Quality Control (1983), the American Society for Testing and Materials (1976), Kume (1985), Montgomery (1996), and Wadsworth, Stephens, and Godfrey (1986).
You can use the constant to calculate an unbiased estimate  of the standard deviation
  of a normal distribution from the sample range of observations:
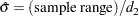 |
Note that the statistical efficiency of this estimate relative to that of the sample standard deviation decreases as increases.
Copyright © SAS Institute, Inc. All Rights Reserved.