| The CAPABILITY Procedure |
Dictionary of Options
The following entries provide detailed descriptions of the options specific to the CDFPLOT statement. The notes Traditional Graphics and Line Printer identify options that can be used only with traditional graphics and line printer plots, respectively. See Dictionary of Common Options for detailed descriptions of options common to all the plot statements.
- ALPHA=value
specifies the shape parameter
 for distribution functions requested with the BETA and GAMMA options. Enclose the ALPHA= option in parentheses after the BETA or GAMMA keywords. If you do not specify a value for , the procedure calculates a maximum likelihood estimate. For examples, see the entries for the BETA and GAMMA options.
 - BETA<(beta-options)>
displays a fitted beta distribution function on the cdf plot. The equation of the fitted cdf is
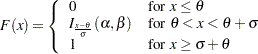
where
 is the incomplete beta function, and
  lower threshold parameter (lower endpoint)
  scale parameter
 shape parameter
 shape parameter
The beta distribution is bounded below by the parameter
 and above by the value
  . You can specify and
  by using the THETA= and SIGMA= beta-options, as illustrated in the following statements, which fit a beta distribution bounded between 50 and 75. The default values for and are 0 and 1, respectively.
 proc capability; cdfplot / beta(theta=50 sigma=25); run;
The beta distribution has two shape parameters,
and  . If these parameters are known, you can specify their values with the ALPHA= and BETA= beta-options. If you do not specify values for and , the procedure calculates maximum likelihood estimates.
 The BETA option can appear only once in a CDFPLOT statement. See Table 5.9 for a list of secondary options you can specify with the BETA distribution option.
- BETA=value
- B=value
specifies the second shape parameter
for beta distribution functions requested by the BETA option. Enclose the BETA= option in parentheses after the BETA keyword. If you do not specify a value for , the procedure calculates a maximum likelihood estimate. For examples, see the preceding entry for the BETA option. - C=value
specifies the shape parameter
 for Weibull distribution functions requested with the WEIBULL option. Enclose the C= option in parentheses after the WEIBULL keyword. If you do not specify a value for , the procedure calculates a maximum likelihood estimate. You can specify the SHAPE= option as an alias for the C= option.
 - CDFSYMBOL='character'
[Line Printer] specifies the character used to plot the points on cdf line printer plots. The default is the plus sign (+). Use the SYMBOL statement to control the plotting symbol in graphical output.
- EXPONENTIAL<(exponential-options)>
- EXP<(exponential-options )>
displays a fitted exponential distribution function on the cdf plot. The equation of the fitted cdf is
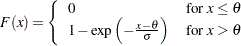
where
threshold parameter scale parameter The parameter
must be less than or equal to the minimum data value. You can specify with the THETA= exponential-option. The default value for is 0. You can specify with the SIGMA= exponential-option. By default, a maximum likelihood estimate is computed for . For example, the following statements fit an exponential distribution with  and a maximum likelihood estimate for :
 proc capability; cdfplot / exponential(theta=10 l=2 color=green); run;
The exponential curve is green and has a line type of 2.
The EXPONENTIAL option can appear only once in a CDFPLOT statement. See Table 5.9 for a list of secondary options you can specify with the EXPONENTIAL option.
- GAMMA<(gamma-options)>
displays a fitted gamma distribution function on the cdf plot. The equation of the fitted cdf is
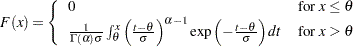
where
threshold parameter scale parameter shape parameter The parameter
for the gamma distribution must be less than the minimum data value. You can specify with the THETA= gamma-option. The default value for is 0. In addition, the gamma distribution has a shape parameter and a scale parameter . You can specify these parameters with the ALPHA= and SIGMA= gamma-options. By default, maximum likelihood estimates are computed for and . For example, the following statements fit a gamma distribution function with  and maximum likelihood estimates for and :
 proc capability; cdfplot / gamma(theta=4); run;
Note that the maximum likelihood estimate of
is calculated iteratively using the Newton-Raphson approximation. The gamma-options ALPHADELTA=, ALPHAINITIAL=, and MAXITER= control the approximation. The GAMMA option can appear only once in a CDFPLOT statement. See Table 5.9 for a list of secondary options you can specify with the GAMMA option.
- LEGEND=name | NONE
[Traditional Graphics] specifies the name of a LEGEND statement describing the legend for specification limit reference lines and superimposed distribution functions. Specifying LEGEND=NONE, which suppresses all legend information, is equivalent to specifying the NOLEGEND option.
- LOGNORMAL<(lognormal-options)>
displays a fitted lognormal distribution function on the cdf plot. The equation of the fitted cdf is
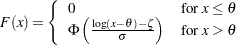
where
 is the standard normal cumulative distribution function, and threshold parameter
  scale parameter shape parameter
 The parameter
for the lognormal distribution must be less than the minimum data value. You can specify with the THETA= lognormal-option. The default value for is 0. In addition, the lognormal distribution has a shape parameter and a scale parameter  . You can specify these parameters with the SIGMA= and ZETA= lognormal-options. By default, maximum likelihood estimates are computed for and . For example, the following statements fit a lognormal distribution function with
  and maximum likelihood estimates for and :
 proc capability; cdfplot / lognormal(theta = 10); run;
The LOGNORMAL option can appear only once in a CDFPLOT statement. See Table 5.9 for a list of secondary options you can specify with the LOGNORMAL option.
- MU=value
specifies the parameter
 for normal distribution functions requested with the NORMAL option. Enclose the MU= option in parentheses after the NORMAL keyword. The default value is the sample mean. For an example, see the entry for the NORMAL option.
 - NOCDFLEGEND
suppresses the legend for the superimposed theoretical cumulative distribution function.
- NOECDF
suppresses the observed distribution function (the empirical cumulative distribution function) of the variable, which is drawn by default. This option enables you to create theoretical cdf plots without displaying the data distribution. The NOECDF option can be used only with a theoretical distribution (such as the NORMAL option).
- NOLEGEND
suppresses legends for specification limits, theoretical distribution functions, and hidden observations. Specifying the NOLEGEND option is equivalent to specifying LEGEND=NONE.
- NORMAL<(normal-options)>
displays a fitted normal distribution function on the cdf plot. The equation of the fitted cdf is
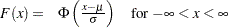
where
is the standard normal cumulative distribution function, and  mean standard deviation
 You can specify known values for
and with the MU= and SIGMA= normal-options, as shown in the following statements: proc capability; cdfplot / normal(mu=14 sigma=.05); run;
By default, the sample mean and sample standard deviation are calculated for
and . The NORMAL option can appear only once in a CDFPLOT statement. For an example, see Output 5.4.1. See Table 5.9 for a list of secondary options you can specify with the NORMAL option. - NOSPECLEGEND
- NOSPECL
suppresses the portion of the legend for specification limit reference lines.
- SIGMA=value
specifies the parameter
for distribution functions requested by the BETA, EXPONENTIAL, GAMMA, LOGNORMAL, NORMAL, and WEIBULL options. Enclose the SIGMA= option in parentheses after the distribution keyword. The following table summarizes the use of the SIGMA= option: Distribution Option
SIGMA= Specifies
Default Value
Alias
BETA
scale parameter
1
SCALE=
EXPONENTIAL
scale parameter
maximum likelihood estimate
SCALE=
GAMMA
WEIBULL
LOGNORMAL
shape parameter
maximum likelihood estimate
SHAPE=
NORMAL
scale parameter
standard deviation
- SYMBOL='character'
[Line Printer] specifies the character used to plot the theoretical distribution function on line printer plots. Enclose the SYMBOL= option in parentheses after the distribution option. The default character is the first letter of the distribution option keyword.
- THETA=value
specifies the lower threshold parameter
for theoretical cumulative distribution functions requested with the BETA, EXPONENTIAL, GAMMA, LOGNORMAL, and WEIBULL options. Enclose the THETA= option in parentheses after the distribution keyword. The default value is 0. - THRESHOLD=value
is an alias for the THETA= option. See the preceding entry for the THETA= option.
- VSCALE=PERCENT | PROPORTION
specifies the scale of the vertical axis. The value PERCENT scales the data in units of percent of observations per data unit. The value PROPORTION scales the data in units of proportion of observations per data unit. The default is PERCENT.
- WEIBULL<(Weibull-options)>
displays a fitted Weibull distribution function on the cdf plot. The equation of the fitted cdf is
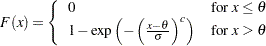
where
threshold parameter scale parameter  shape parameter
The parameter
must be less than the minimum data value. You can specify with the THETA= Weibull-option. The default value for is 0. In addition, the Weibull distribution has a shape parameter and a scale parameter . You can specify these parameters with the SIGMA= and C= Weibull-options. By default, maximum likelihood estimates are computed for and . For example, the following statements fit a Weibull distribution function with  and maximum likelihood estimates for and :
 proc capability; cdfplot / weibull(theta=15); run;
Note that the maximum likelihood estimate of
is calculated iteratively using the Newton-Raphson approximation. The Weibull-options CDELTA=, CINITIAL=, and MAXITER= control the approximation. The WEIBULL option can appear only once in a CDFPLOT statement. See Table 5.9 for a list of secondary options you can specify with the WEIBULL option.
- ZETA=value
specifies a value for the scale parameter
for a lognormal distribution function requested with the LOGNORMAL option. Enclose the ZETA= option in parentheses after the LOGNORMAL keyword. If you do not specify a value for , a maximum likelihood estimate is computed. You can specify the SCALE= option as an alias for the ZETA= option.
Copyright © SAS Institute, Inc. All Rights Reserved.