| The CAPABILITY Procedure |
Assumptions and Terminology for Capability Indices
One of the fundamental assumptions in process capability analysis is that the process must be in statistical control. Without statistical control, the process is not predictable, the concept of a process distribution does not apply, and quantities related to the distribution, such as probabilities, percentiles, and capability indices, cannot be meaningfully estimated. Additionally, all of the standard process capability indices described in the next section require that the process distribution be normal, or at least approximately normal.
In many industries, statistical control is routinely checked with a Shewhart chart (such as an  and
and  chart) before capability indices such as
 |
are computed. The control chart analysis yields estimates for the process mean  and standard deviation
  , which are based on subgrouped data and can be used to estimate
  . In particular, can be estimated by
 |
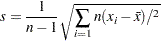
rather than the ungrouped sample standard deviation
 |
You can use the SHEWHART procedure to carry out the control chart analysis and to compute capability indices based on  . On the other hand, the CAPABILITY procedure computes indices based on
  .
.
Some industry manuals distinguish these two approaches. For instance, the ASQC/AIAG manual Fundamental Process Control uses the notation for the estimate based on , and it uses the notation  for the estimate based on . However, assuming that the process is in control and only common cause variation is present, both and are estimates of the same parameter , and so there is fundamentally no difference in the two approaches1.
Once control has been established, attention should focus on the distribution of the process measurements, and at this point there is no practical or statistical advantage to working with subgrouped measurements. In fact, the use of is closely associated with a wide variety of methods that are highly useful for process capability analysis, including tests for normality, graphical displays such as histograms and probability plots, and confidence intervals for parameters and capability indices.
Copyright © SAS Institute, Inc. All Rights Reserved.