| The CAPABILITY Procedure |
Robust Estimators
The CAPABILITY procedure provides several methods for computing robust estimates of location and scale, which are insensitive to outliers in the data.
Winsorized Means
The  -times Winsorized mean is a robust estimator of location which is computed as
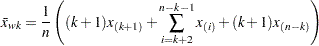 |
where  is the number of observations, and
  is the
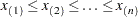
  th order statistic when the observations are arranged in increasing order:
 |
The Winsorized mean is the mean computed after replacing the smallest observations with the  st smallest observation, and the largest observations with the st largest observation.
For data from a symmetric distribution, the Winsorized mean is an unbiased estimate of the population mean. However, the Winsorized mean does not have a normal distribution even if the data are normally distributed.
The Winsorized sum of squared deviations is defined as
 |
A Winsorized  test is given by
 |
where the standard error of the Winsorized mean is
 |
When the data are from a symmetric distribution, the distribution of  is approximated by a Student’s distribution with
  degrees of freedom. Refer to Tukey and McLaughlin (1963) and Dixon and Tukey (1968).
A  % Winsorized confidence interval for the mean has upper and lower limits
 |
where  is the
  th percentile of the Student’s distribution with degrees of freedom.
Trimmed Means
The -times trimmed mean is a robust estimator of location which is computed as
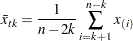 |
where is the number of observations, and  is the th order statistic when the observations are arranged in increasing order:
|
The trimmed mean is the mean computed after the smallest observations and the largest observations in the sample are deleted.
For data from a symmetric distribution, the trimmed mean is an unbiased estimate of the population mean. However, the trimmed mean does not have a normal distribution even if the data are normally distributed.
A robust estimate of the variance of the trimmed mean  can be obtained from the Winsorized sum of squared deviations; refer to Tukey and McLaughlin (1963). the corresponding trimmed test is given by
 |
where the standard error of the trimmed mean is
 |
and  is the square root of the Winsorized sum of squared deviations.
When the data are from a symmetric distribution, the distribution of is approximated by a Student’s distribution with degrees of freedom. Refer to Tukey and McLaughlin (1963) and Dixon and Tukey (1968).
A % trimmed confidence interval for the mean has upper and lower limits
 |
where is the th percentile of the Student’s distribution with degrees of freedom.
Robust Estimates of Scale
The sample standard deviation, which is the most commonly used estimator of scale, is sensitive to outliers. Robust scale estimators, on the other hand, remain bounded when a single data value is replaced by an arbitrarily large or small value. The CAPABILITY procedure computes several robust measures of scale, including the interquartile range Gini’s mean difference  , the median absolute deviation about the median (MAD),
  , and
, and  . In addition, the procedure computes estimates of the normal standard deviation
  derived from each of these measures.
The interquartile range (IQR) is simply the difference between the upper and lower quartiles. For a normal population, can be estimated as IQR/1.34898.
Gini’s mean difference is computed as
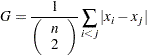 |
For a normal population, the expected value of is  . Thus
  is a robust estimator of when the data are from a normal sample. For the normal distribution, this estimator has high efficiency relative to the usual sample standard deviation, and it is also less sensitive to the presence of outliers.
A very robust scale estimator is the MAD, the median absolute deviation from the median (Hampel 1974), which is computed as
 |
where the inner median,  , is the median of the observations, and the outer median (taken over ) is the median of the absolute values of the deviations about the inner median. For a normal population, 1.4826MAD is an estimator of .
The MAD has low efficiency for normal distributions, and it may not always be appropriate for symmetric distributions. Rousseeuw and Croux (1993) proposed two statistics as alternatives to the MAD. The first is
 |
where the outer median (taken over ) is the median of the medians of  ,
,  . To reduce small-sample bias,
  is used to estimate , where
  is a correction factor; refer to Croux and Rousseeuw (1992).
The second statistic is
 |
where
 |
and  . In other words, is 2.2219 times the th order statistic of the
  distances between the data points. The bias-corrected statistic
  is used to estimate , where
  is a correction factor; refer to Croux and Rousseeuw (1992).
Copyright © SAS Institute, Inc. All Rights Reserved.