Introduction to Project Management
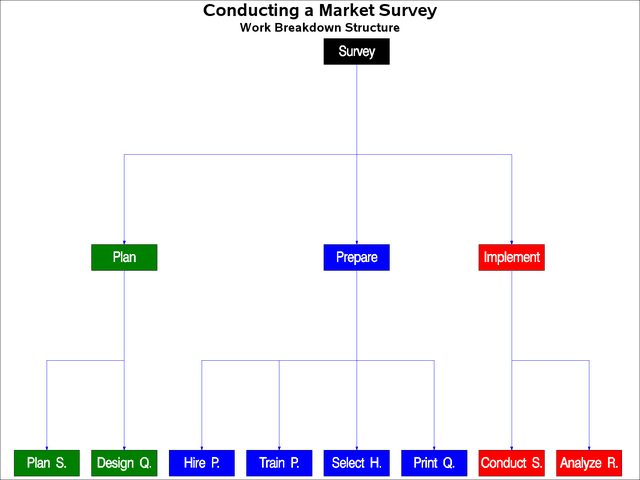
Example 3.2 Work Breakdown Structure
A tree diagram is a useful method of visualizing the work breakdown structure (WBS) of a project. For the survey project, the activities are divided into three phases. In this example, the NETDRAW procedure is used to represent the work breakdown structure of the project. The following program saves the data in a Network data set that is input to PROC NETDRAW. The TREE option is used to draw the WBS structure in the form of a tree (Output 3.2.1).
data wbs;
   input parent  $ 1-10
         child   $ 12-21
         style;
   datalines;
Survey     Plan          1
Survey     Prepare       1
Survey     Implement     1
Plan       Plan S.       2
Plan       Design Q.     2
Prepare    Hire P.       3
Prepare    Train P.      3
Prepare    Select H.     3
Prepare    Print Q.      3
Implement  Conduct S.    4
Implement  Analyze R.    4
Plan S.                  2
Design Q.                2
Hire P.                  3
Train P.                 3
Select H.                3
Print Q.                 3
Conduct S.               4
Analyze R.               4
;
pattern1 v=s c=black;
pattern2 v=s c=green;
pattern3 v=s c=blue;
pattern4 v=s c=red;

title  h=2.0   'Conducting a Market Survey';
title2 h=1.4  'Work Breakdown Structure';

proc netdraw data=wbs graphics;
    actnet/act=parent
           succ=child coutline=black tree rotatetext
           ctext=white font=swiss rectilinear
           htext=3 compress rotate
           ybetween=3 xbetween=50 pattern=style
           centerid;
 run;
Output 3.2.1: Work Breakdown Structure of SURVEY Project