Introduction to Project Management
Having defined the project and ensured that all the relationships have been modeled correctly, you can schedule the activities
in the project by invoking PROC CPM. Suppose the activities can occur only on weekdays, and there is a holiday on July 4,
2003. Holiday information is passed to PROC CPM using the Holiday data set holidata. The following statements schedule the project to start on July 1, 2003. The early and late start schedules and additional
project information are saved in the output data set survschd. The output data set produced by PROC CPM can then be used to generate a variety of reports. In this example, the data set
is first sorted by the variable E_START and then displayed using the PRINT procedure (see Output 3.3.1).
data holidata;
   format hol date7.;
   hol = '4jul03'd;
run;
proc cpm data=survey date='1jul03'd out=survschd
         interval=weekday holidata=holidata;
   activity   activity;
   successor  succ1-succ3;
   duration   duration;
   id         id phase;
   holiday    hol;
   run;

proc sort;
   by e_start;
run;

title  'Conducting a Market Survey';
title2 'Early and Late Start Schedule';

proc print;
run;
Output 3.3.1: Project Schedule: Listing
| Conducting a Market Survey |
| Early and Late Start Schedule |
| Obs | activity | succ1 | succ2 | succ3 | duration | id | phase | E_START | E_FINISH | L_START | L_FINISH | T_FLOAT | F_FLOAT |
|---|---|---|---|---|---|---|---|---|---|---|---|---|---|
| 1 | plan sur | hire per | design q | 4 | Plan Survey | Plan | 01JUL03 | 07JUL03 | 01JUL03 | 07JUL03 | 0 | 0 | |
| 2 | hire per | trn per | 5 | Hire Personnel | Prepare | 08JUL03 | 14JUL03 | 08JUL03 | 14JUL03 | 0 | 0 | ||
| 3 | design q | trn per | select h | print q | 3 | Design Questionnaire | Plan | 08JUL03 | 10JUL03 | 09JUL03 | 11JUL03 | 1 | 0 |
| 4 | select h | cond sur | 3 | Select Households | Prepare | 11JUL03 | 15JUL03 | 15JUL03 | 17JUL03 | 2 | 2 | ||
| 5 | print q | cond sur | 4 | Print Questionnaire | Prepare | 11JUL03 | 16JUL03 | 14JUL03 | 17JUL03 | 1 | 1 | ||
| 6 | trn per | cond sur | 3 | Train Personnel | Prepare | 15JUL03 | 17JUL03 | 15JUL03 | 17JUL03 | 0 | 0 | ||
| 7 | cond sur | analyze | 10 | Conduct Survey | Implement | 18JUL03 | 31JUL03 | 18JUL03 | 31JUL03 | 0 | 0 | ||
| 8 | analyze | 6 | Analyze Results | Implement | 01AUG03 | 08AUG03 | 01AUG03 | 08AUG03 | 0 | 0 |
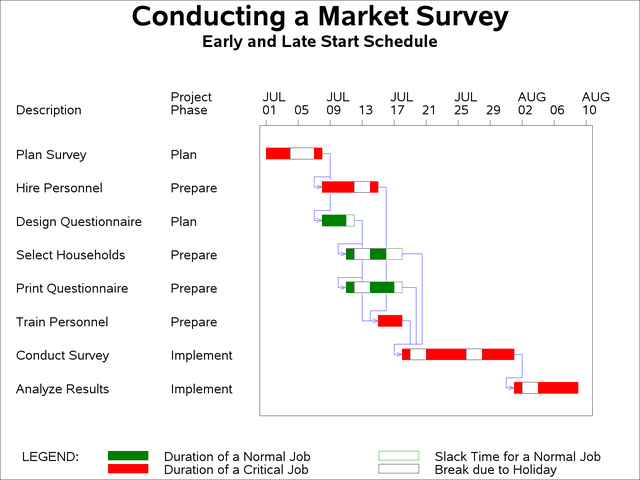
The schedule produced by PROC CPM is then graphed by invoking PROC GANTT, as shown in the following code. The CALENDAR procedure or NETDRAW procedure can also be used to display the schedule. The Gantt chart produced is shown in Output 3.3.2. Note that the precedence relationships are displayed on the Gantt chart.
goptions hpos=80 vpos=43;
pattern1 c=green v=s;     /* duration of a non-critical activity   */
pattern2 c=green v=e;     /* slack time for a noncrit. activity    */
pattern3 c=red   v=s;     /* duration of a critical activity       */
pattern4 c=magenta v=e;   /* slack time for a supercrit. activity  */
pattern5 c=magenta v=s;   /* duration of a supercrit. activity     */
pattern6 c=cyan v=s;      /* actual duration of an activity        */
pattern7 c=black v=e;     /* break due to a holiday                */

title c=black h=2.5 'Conducting a Market Survey';
title2 c=black h=1.5 'Early and Late Start Schedule';
proc gantt graphics data=survschd holidata=holidata;
   chart / holiday=(hol) interval=weekday
           skip=2 height=1.4 nojobnum
           compress noextrange
           activity=activity succ=(succ1-succ3)
           cprec=blue caxis=black ;
   id   id phase;
   run;