| The Projman Application |
| Color Options |
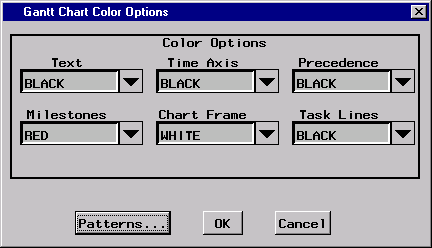
This window is used to set options that control the color of various features of the Gantt chart report. Note that these options are ignored unless the report Resolution option is set for graphics-quality output.

Text
The Text box can be used to specify the color to use for displaying text that appears on the Gantt chart. Note that this color specification does not apply to titles, footnotes or any annotated text.
Time Axis
The Time Axis box can be used to specify the color to use for displaying the time axis along the top of the Gantt chart. The same color is also used for the frame around the chart area (where the activity bars are drawn).
Precedence
The Precedence box can be used to specify the color to use for drawing the precedence connections on the Gantt chart. Note that this option is used only when precedence relationships are to be drawn on the Gantt chart.
Milestones
The Milestone box can be used to specify the color to use for drawing any milestone symbols that appear on the Gantt chart.
Chart Frame
The Chart Frame box can be used to specify the background color for the chart area (where the activity bars are drawn).
Task Lines
The Task Lines box can be used to specify the color to use for drawing the task lines on the Gantt chart. Note that this option is used only when task lines are to be drawn on the Gantt chart.
Copyright © SAS Institute, Inc. All Rights Reserved.