| The CPM Procedure |
Example 4.5 Precedence Gantt Chart
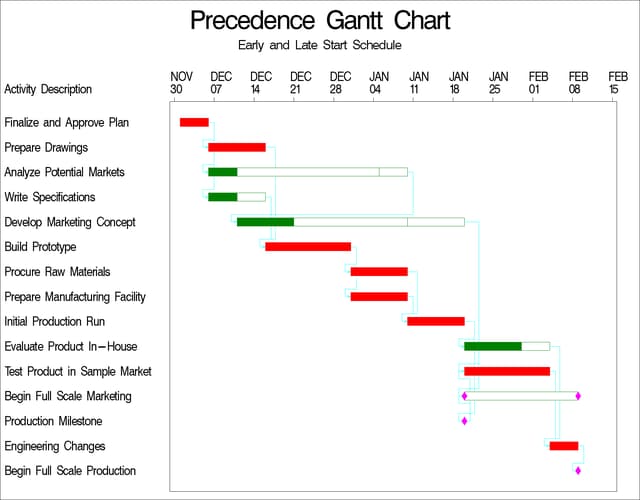
This example produces a Gantt chart of the schedule obtained from PROC CPM. The example uses the network described in Example 4.2 (AOA format) and assumes that the data set SAVE contains the schedule produced by PROC CPM and sorted by the variable E_START. The Gantt chart produced shows the early and late start schedules as well as the precedence relationships between the activities. The precedence information is conveyed to PROC GANTT through the TAILNODE= and HEADNODE= options.
data details;
   input task $ 1-12 dept $ 15-27 descrpt $ 30-59;
   label dept = "Department"
         descrpt = "Activity Description";
   datalines;
Dev. Concept  Planning       Finalize and Approve Plan
Drawings      Engineering    Prepare Drawings
Study Market  Marketing      Analyze Potential Markets
Write Specs   Engineering    Write Specifications
Prototype     Engineering    Build Prototype
Mkt. Strat.   Marketing      Develop Marketing Concept
Materials     Manufacturing  Procure Raw Materials
Facility      Manufacturing  Prepare Manufacturing Facility
Init. Prod.   Manufacturing  Initial Production Run
Evaluate      Testing        Evaluate Product In-House
Test Market   Testing        Test Product in Sample Market
Changes       Engineering    Engineering Changes
Production    Manufacturing  Begin Full Scale Production
Marketing     Marketing      Begin Full Scale Marketing
Dummy                        Production Milestone
;

data widgeta;
   merge widgaoa details;
   run;
* specify the device on which you want the chart printed;

goptions vpos=50 hpos=80 border;

title f=swiss 'Precedence Gantt Chart';
title2 f=swiss 'Early and Late Start Schedule';

proc gantt graphics data=save;
   chart / compress tailnode=tail headnode=head
           font=swiss height=1.5 nojobnum skip=2
           cprec=cyan cmile=magenta
           caxis=black
           dur=days increment=7 nolegend;
   id descrpt;
   run;
Output 4.5.1
Gantt Chart of Project
Copyright © SAS Institute, Inc. All Rights Reserved.