Creating the Default Output
The
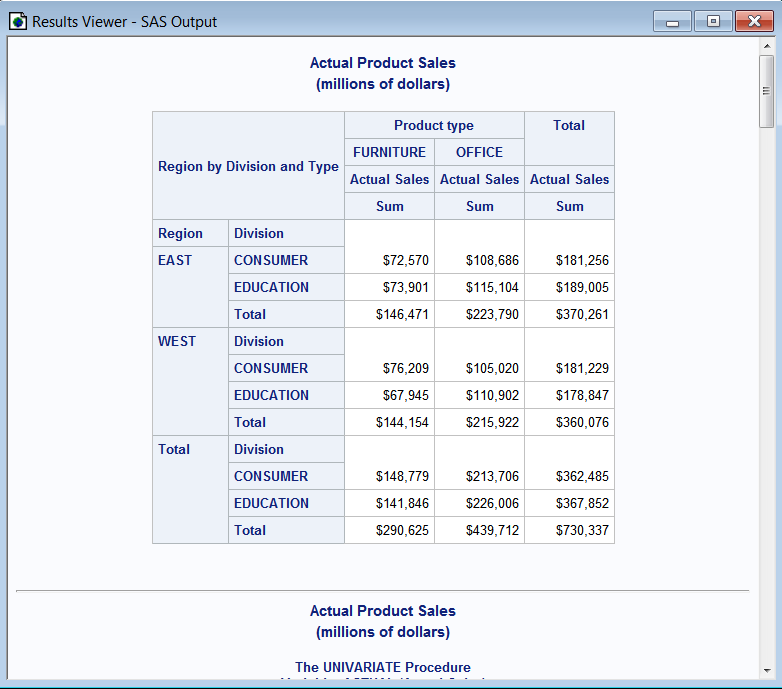
following program creates the original PROC TABULATE, PROC UNIVARIATE,
and PROC SGPANEL output. When you run this example program, you are
creating ODS output. By default, HTML is created when you run code
in the SAS windowing environment for Windows or UNIX. Your output
(including your graphics) is sent to your current working directory.
This output is viewable in the Results Viewer.
options nodate nonumber;
proc sort data=sashelp.prdsale out=prdsale;
    by Country;
run;

proc tabulate data=prdsale;
class region division prodtype;
classlev region division prodtype;
var actual;
keyword all sum;
keylabel all='Total';
table (region all)*(division all),
         (prodtype all)*(actual*f=dollar10.) /
         misstext=[label='Missing']
         box=[label='Region by Division and Type'];

title 'Actual Product Sales';
title2 '(millions of dollars)';
run;
proc univariate data=prdsale;
by Country;
var actual;
run;
title 'Sales Figures for First Quarter by Product';
proc sgpanel data=prdsale;
    where quarter=1;
    panelby product / novarname;
    vbar region / response=predict;
    vline region / response=actual lineattrs=GraphFit;
    colaxis fitpolicy=thin;
    rowaxis label='Sales';
run;
When you create this
output, you determine that there is more information than you want.
Specifically, you need only the Extreme Observations, Quantiles, and
Moments tables from the PROC UNIVARIATE output. In addition, you want
to make the output easier to read. The steps in the following chapters
show you how to accomplish these tasks.
Default Output
