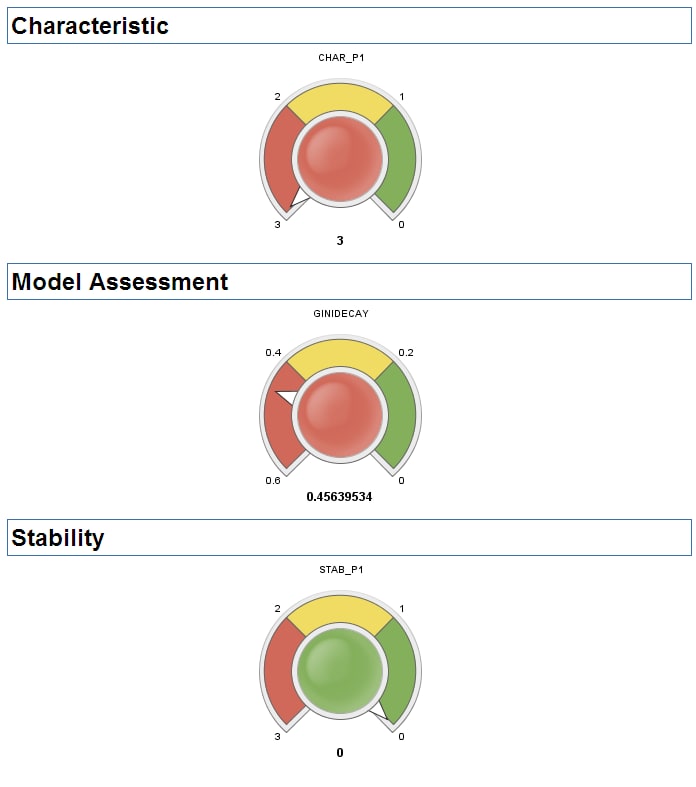
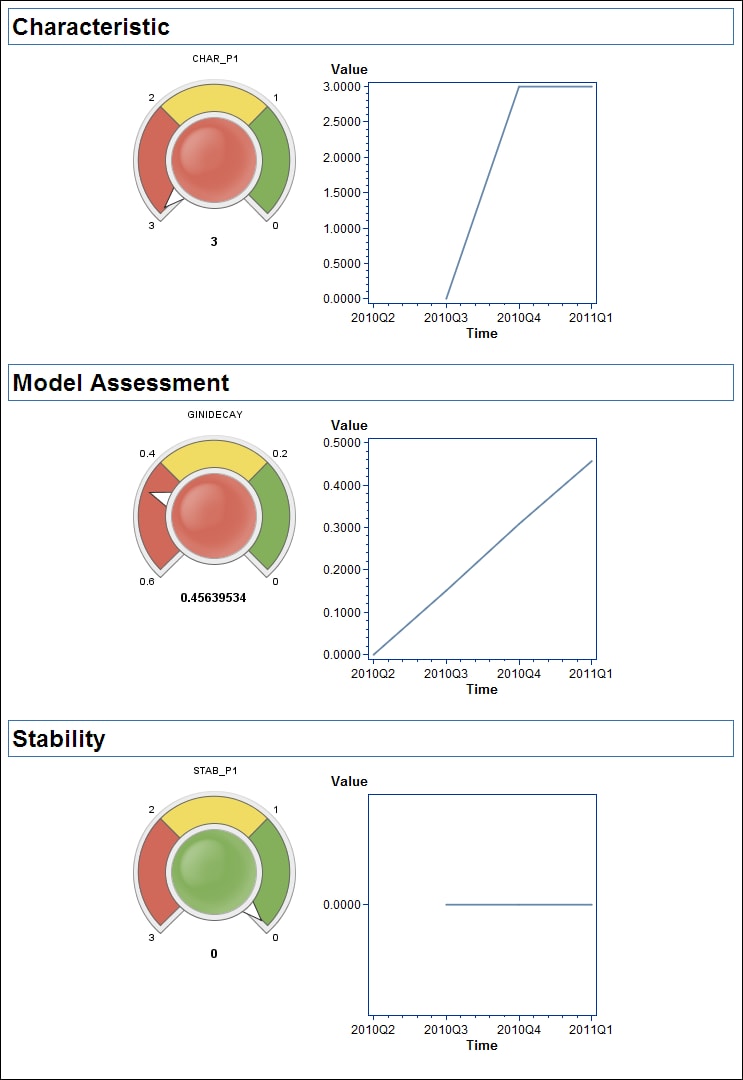
Here is an example of
the graphs that are displayed in the Monitoring Report for the HMEQ
project.
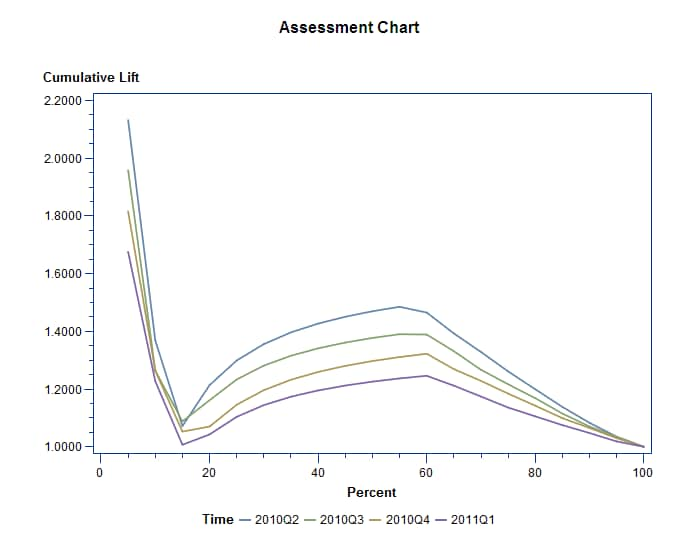
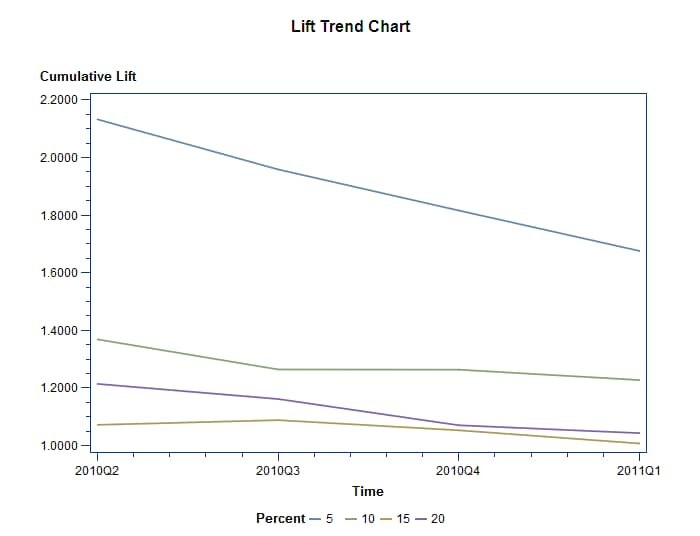
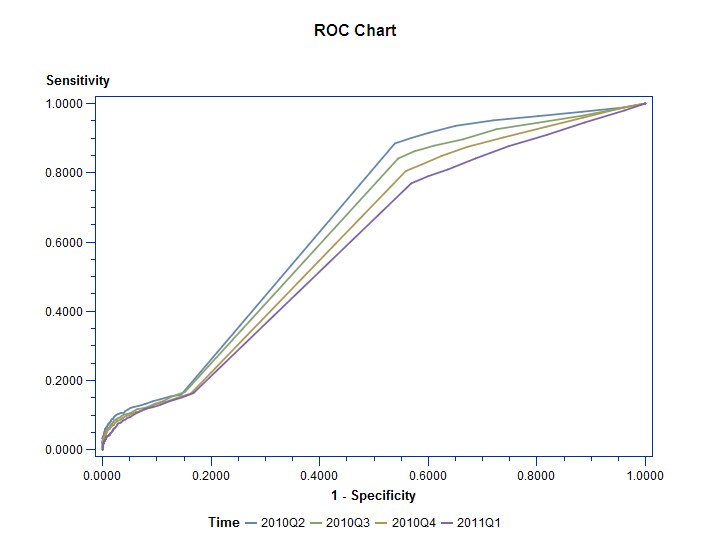
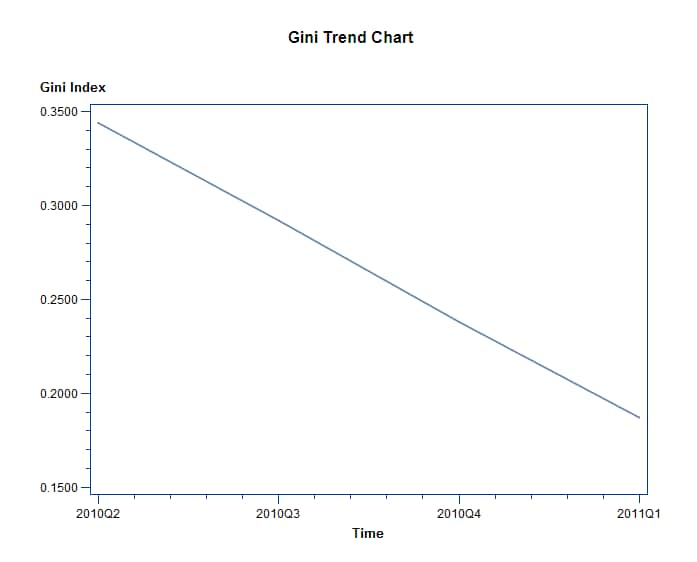
Multiple assessment
charts are displayed in the Monitoring Report. This is a cumulative
lift example.
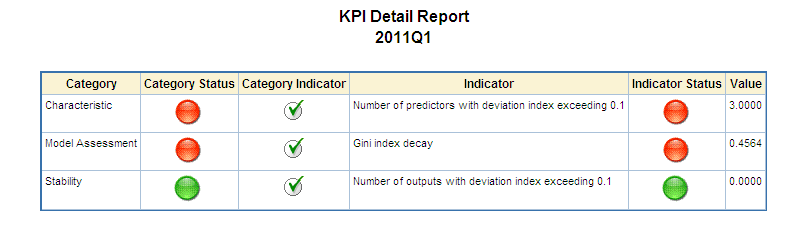
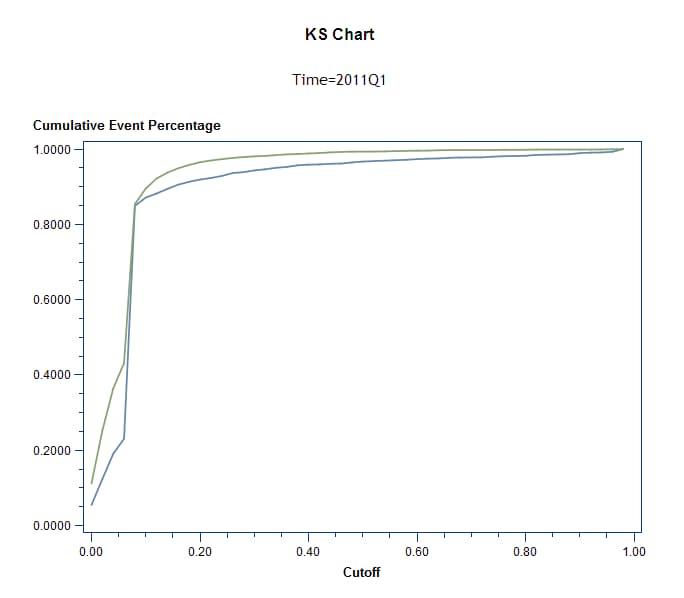
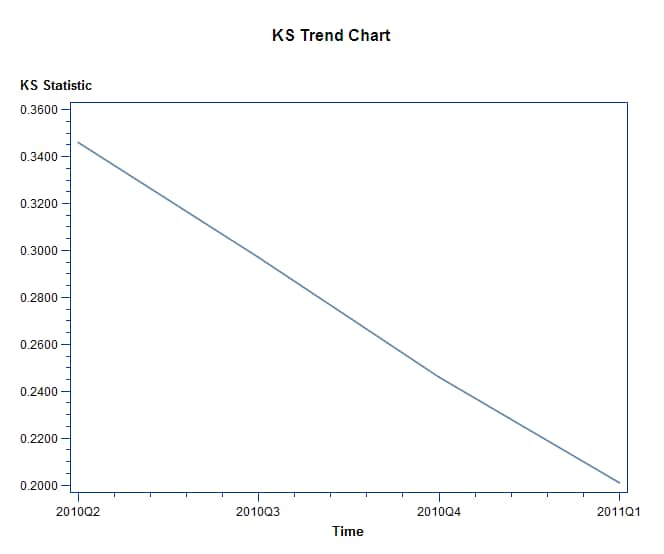
A KS Chart for each
time frame is displayed on the Monitoring Report. Here is an example
for the first quarter of 2011.