Types of Performance Monitoring Reports
Overview of the Types of Performance Monitoring Reports
After a champion model
is in production, you can monitor the performance of the model by
analyzing the SAS Model Manager performance reports. You can create
the reports interactively using the Define Performance
Task wizard and the PerformanceMonitor node from the project folder in the Project Tree or you can submit
batch programs within SAS.
You can create the following
types of performance reports:
The Summary report uses the information within organizational folders, project
folders, and version folders to summarize the number of champion models,
the number of models not in production, the model age, the number
of reports, the input variables, and the target variables. The summary
information enables you to compare the contents of organizational
folders, projects, and versions. You view the Summary report from
the Annotations view in the Project perspective.
The two data composition
reports, the Characteristic report and the Stability report, detect
and quantify shifts in the distribution of variable values that occur
in input data and scored output data over a period of time. The Characteristic
report detects shifts in the distribution of input variables over
time. The Stability report measures shifts in the scored output data
that a model produces. By analyzing these shifts, you can gain insights
on scoring input and output variables.
When you create Data
Composition reports and Model Monitoring reports, you can set performance
index warnings and alerts. When certain thresholds are met, SAS Model
Manager can send a warning and alert notification to e-mail addresses
that you configure either in the Define Performance Task wizard or in a SAS program.
You view the Data Composition
reports and the Model Assessment reports from the version Performance node.
To explore the degradation of a model's
performance over time using these charts, right-click in the chart
and select Data Options. From the Data Options window, you can modify various values to
further explore the degradation of a model. You can set different
data filters and select different variables to replot a chart.
Summary Report
The Summary report summarizes
the contents of different organizational folders, projects, and versions.
The contents of the
Summary report is dynamic and is updated according to the folder that
you select in the Project Tree. The scope of the information reported
is defined by the collection of folders and objects that exist beneath
the folder that is selected.
To view the Summary
report, click the Summary tab that is in
the Annotations view of the Projects perspective.
Use the following sections
to evaluate and compare the contents of the different folders in the
Project Tree:
Use the General Properties section to browse the number of champion
models, the number of versions, the number of scoring tasks, and the
number of candidate models.
Use the Production Models Aging Report to view the number and
aging distribution of champion models. The binned chronology report
lists the number of champion models by deployment age, using six intervals
to classify the deployment ages. The first four intervals combine
to create a span of 365 days. The fifth interval adds another 365
days. The sixth interval reports the number of models that have been
in production for two years or more.
Use the Summary of Reports section to browse the number of reports
that have been generated in the Reports folder
for the selected folder.
Use the Model Target Variable Report to see the frequency with
which target variables are used in the models that exist for the selected
folder. Each unique model target variable is reported, listing the
number of models that use that variable as a target variable.
Data Composition Reports
Overview of Characteristic and Stability Reports
Together, the Characteristic
and Stability reports detect and quantify shifts that can occur in
the distribution of model training data, scoring input data, and model
score output data.
The Characteristic report
detects shifts in the distributions of input variables that are submitted
for scoring over time. The Stability report measures shifts in the
scored output data that a model produces. If a Characteristic report
identifies a distribution shift in the input data, the corresponding
Stability report can help to assess the model's sensitivity to the
distribution shift in the input data, in terms of the predictive performance
of the scoring input variables.
While the Characteristic
report indicates changes to the scope and composition of the submitted
data sets over time, the Stability report evaluates the impact of
the data variation on the model's predictive output during the same
interval.
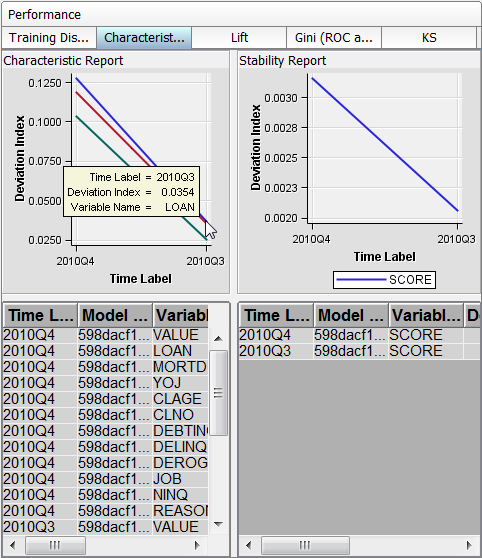
Characteristic Report
The Characteristic report
detects and quantifies the shifts in the distribution of variable
values in the input data over time. Input data variable distribution
shifts can point to significant changes in customer behavior that
are due to new technology, competition, marketing promotions, new
laws, or other influences.
To find shifts, the
Characteristic report compares the distributions of the variables
in these two data sets:
If large enough shifts
occur in the distribution of variable values over time, the original
model might not be the best predictive or classification tool to use
with the current data.
The Characteristic report
uses a deviation index to quantify the shifts in a variable's values
distribution that can occur between the training data set and the
current data set. The deviation index is computed for each predictor
variable in the data set, using this equation:

Numeric predictor variable
values are placed into bins for frequency analysis. Outlier values
are removed to facilitate better placement of values and to avoid
scenarios that can aggregate most observations into a single bin.
If the training data
set and the current data set have identical distributions for a variable,
the variable's deviation index is equal to 0. A variable with a deviation
index value that is P1>2 is classified as having a mild deviation.
The Characteristic report uses the performance measure P1 to count
the number of variables that receive a deviation index value that
is greater than 0.1.
A variable that has
a deviation index value that is P1>5 or P25>0 is classified
as having a significant deviation. A performance measure P25 is used
to count the number of variables that have significant deviations,
or the number of input variables that receive a deviation index score
value that is greater than or equal to 0.25.
Stability Report
The Stability report
evaluates changes in the distribution of scored output variable values
as models score data over time. It uses the same deviation index function
that is used by the Characteristic report, except that the Stability
report detects and quantifies shifts in the distribution of output
variable values in the data that is produced by the models.
If an output variable
from the training data set and the output variable from the current
data set have identical distributions, then that output variable's
deviation index is equal to zero. An output variable with a deviation
index value that is greater than 0.10 and less than 0.25 is classified
as having a mild deviation. A variable that has a deviation index
value that is greater than 0.30 is classified as having a significant
deviation. Too much deviation in predictive variable output can indicate
that model tuning, retraining, or replacement might be necessary.
Model Monitoring Reports
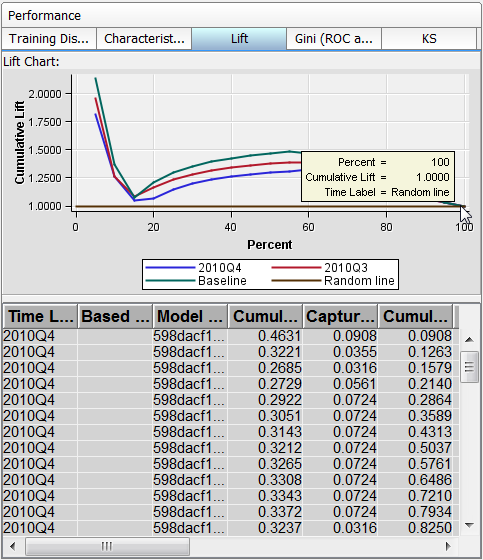
Monitoring Lift Report
The monitoring Lift
report provides a visual summary of the usefulness of the information
provided by a model for predicting a binary outcome variable. Specifically,
the report summarizes the utility that one can expect by using the
champion model as compared to using baseline information only. Baseline
information is the prediction accuracy performance of the initial
performance monitoring task or batch program using operational data.
A monitoring Lift report
can show a model's cumulative
lift at a given point in time or the sequential lift performance of
a model's lift over time. To detect model performance degradation,
you can set the Lift report performance indexes Lift5Decay, Lift10Decay,
Lift15Decay, and Lift20Decay. The data that underlies the Lift report
is contained in the report file mm_lift.sas7bdat in the Resources folder.
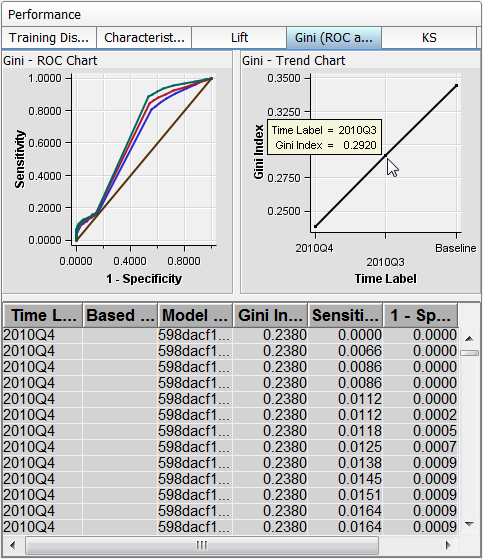
Monitoring Gini (ROC and Trend) Report
The monitoring Gini (ROC and Trend) reports show you the predictive
accuracy of a model that has a binary target. The plot displays sensitivity
information about the y-axis and 1–Specificity information
about the x-axis. Sensitivity is the proportion of true positive events.
Specificity is the proportion of true negative events. The Gini index
is calculated for each ROC curve. The Gini coefficient, which represents
the area under the ROC curve, is a benchmark statistic that can be
used to summarize the predictive accuracy of a model.
Use the monitoring Gini (ROC and Trend) report to detect degradations in
the predictive power of a model.
The data that underlies
the monitoring Gini (ROC and Trend) report
is contained in the report component file mm_roc.sas7bdat.
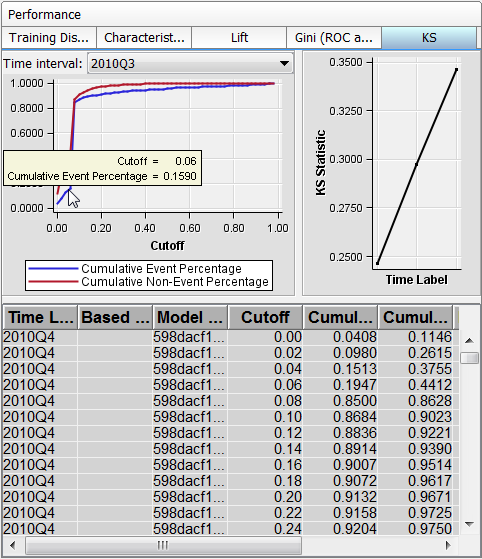
KS Report
The KS report contains
the Kolmogorov-Smirnov (KS) test plots for models with a binary target.
The KS statistic measures the maximum vertical separation, or deviation
between the cumulative distributions of events and non-events. This
trend report uses a summary data set that plots the KS statistic and
the KS probability cutoff values over time.
Use the KS report to
detect degradations in the predictive power of a model. To scroll
through a successive series of KS performance depictions, select a
time interval from the Time Interval list
box. If model performance is declining, it is indicated by the decreasing
distances between the KS plot lines.
To detect model performance
degradation, you can set the ksDecay performance index in the KS report.