To create the monitoring
reports you run the
Define Performance Task wizard to generate SAS code. You then execute the generated code.
Execution of the generated code creates the SAS data sets that are
used to display the monitoring reports from the version
Performance node.
To create the reports,
follow these steps:
-
Right-click the project
name and select
Define Performance Task. The
Define Performance Task wizard appears, and creates
a
PerformanceMonitor node if one does not
exist.
-
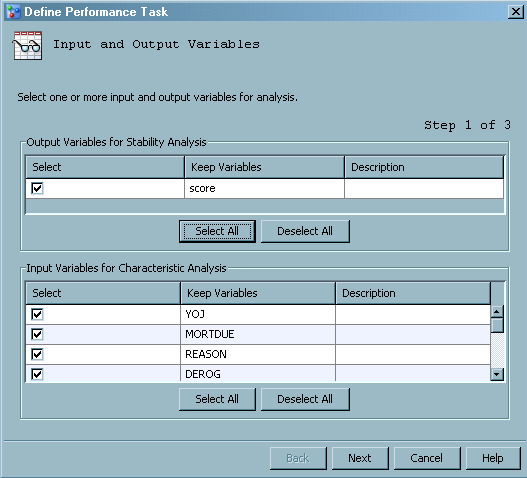
In the
Output
Variables for Stability Analysis table, select the output
variable or variables. To select all output variables, click
Select All.
-
In the
Input
Variables for Characteristic Analysis table, select the
input variables. To select all input variables, click
Select All. Click
Next.
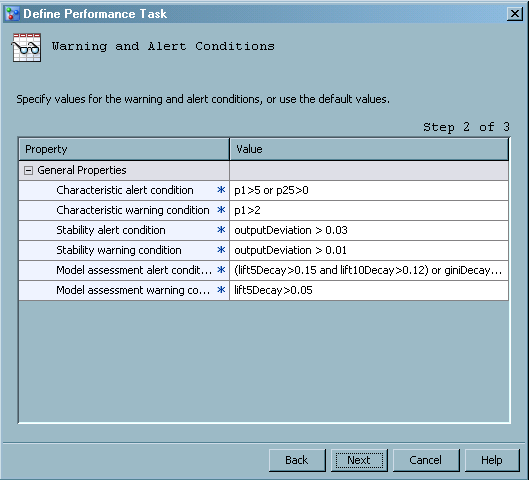
-
For each general property
in the table, verify the values for the warning and alert conditions.
Modify the values as necessary. Make sure that the values are not
enclosed in quotation marks. Click
Next.
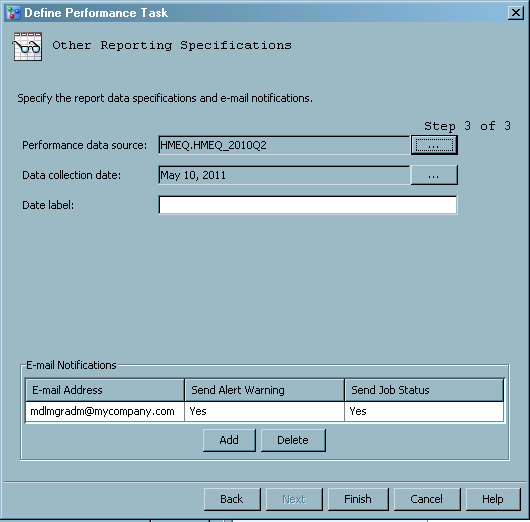
-
Click the ellipsis button

for the
Performance data source box and select a performance data source.
-
Click the ellipsis button
for the
Data collection date box and select a date. The date can be any date in the time period
when the performance data was collected. SAS Model Manager uses the
date value to sequence data. Therefore, you can select any date in
the time period when the performance data source was collected.
-
To add a label for the
date, type the label in the
Date label box.
The date label represents the timeframe of the performance data source.
Date labels appear on the report charts. In order for the chart to
be readable, select short, clear date labels.
-
(Optional) To send the
scoring results by e-mail, click the
Add button in the
E-mail to table. The
Add Contact window appears.
-
-
Select either
Yes or
No if you want an alert
and warnings to be sent by e-mail when alert or warning thresholds
have been exceeded.
-
Select either
Yes or
No if you want a completion
notice to be sent by e-mail every time the performance task runs.
-
Click
Finish. The
Working status box appears while the
code is generated.
-
When the code generation
is complete, the
Information window displays
a confirmation message Click
OK. You can
view the generated code in the project
PerformanceMonitor folder.
-
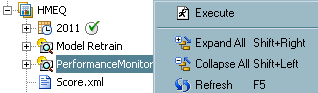
To execute the generated
code, right-click the
PerformanceMonitor folder
and select
Execute. SAS Model Manager saves
the data sets that create the monitoring reports in the default version
Resources folder.
Note: If the report creation fails,
you can view the SAS log to look for error messages by selecting the
PerformanceMonitor.log file in the
PerformanceMonitor node.
-
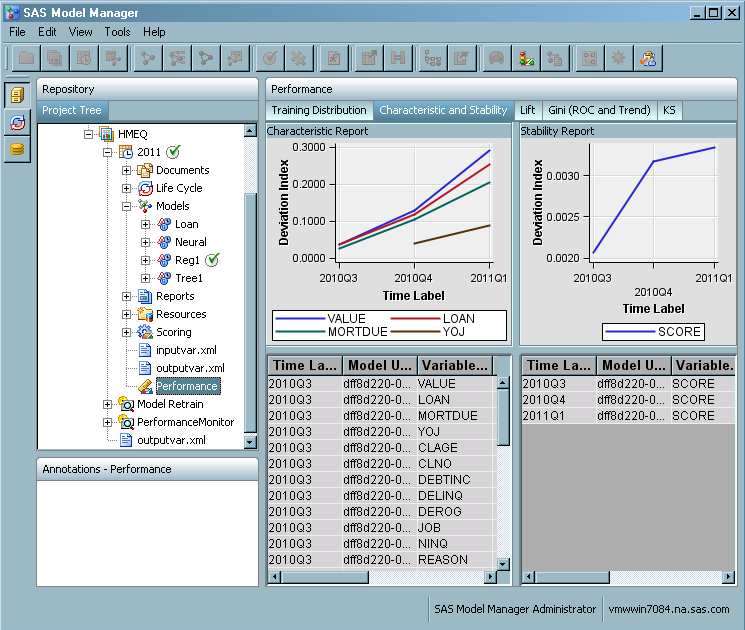
To view the reports,
click on the
Performance node. On the right,
click the tab for the report that you want to view.