In this exercise, you
create performance monitoring reports for all projects within a project
control group, and you run the
Monitor Performance of
Champion Models wizard to generate and execute the code.
Execution of the generated code creates the SAS data sets that are
used to display the performance monitoring reports from the version
Performance node.
To monitor the performance
of the champion models for all projects:
-
Right-click the project
control group
Portfolio 1 in the project
tree, and select
Monitor Performance. The
Monitor
Performance of Champion Models wizard appears.
Note: The
Monitor Performance menu
item is available only to SAS Model Manager administrators and advanced
users.
-
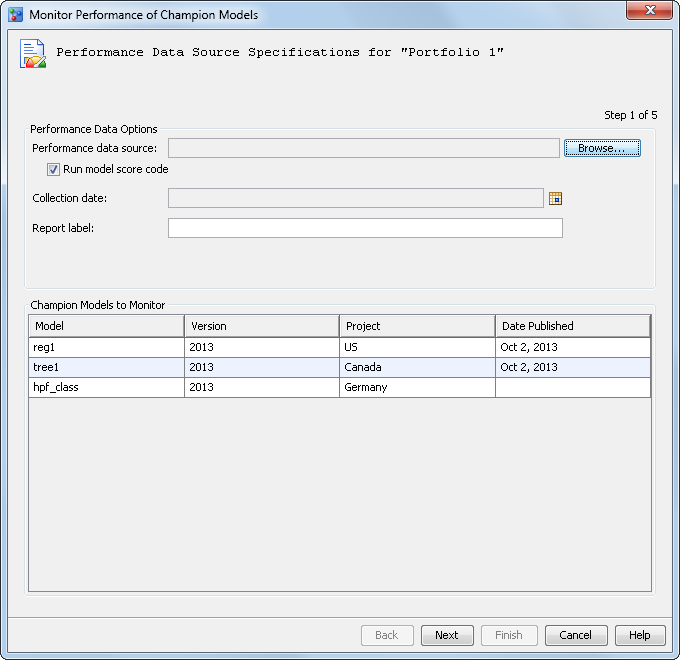
Specify the performance
data options:
-
Click
Browse to
select the performance data source. Navigate to the location of the
Tutorial10 library
folder and select
HMEQ_2012Q1_SEG. Click
OK.
Note: The performance data source
must contain the same segment identifier variables as the control
table. For this exercise the variable is
segID.
-
To run the model score code in
the performance monitor job, select the
Run model score
code check box. If you do not select the check box is
not selected, ensure that all of the scoring output variables for
stability analysis are in the performance data source. Otherwise,
you will receive an error message.
-
Click

to select a collection date to associate with the
performance data. The date can be any date in the time period when
the performance data was collected. For this exercise, select
March
                                             31, 2012
-
Enter a report label, such as
2012Q1 to
associate with the performance data. The report label represents the
time point of the performance data source. Because the report label
appears in the performance charts, use a label that has not been used
for another time period, is short, and is understandable (for example,
2012Q1 or 2012).
Click
Next.
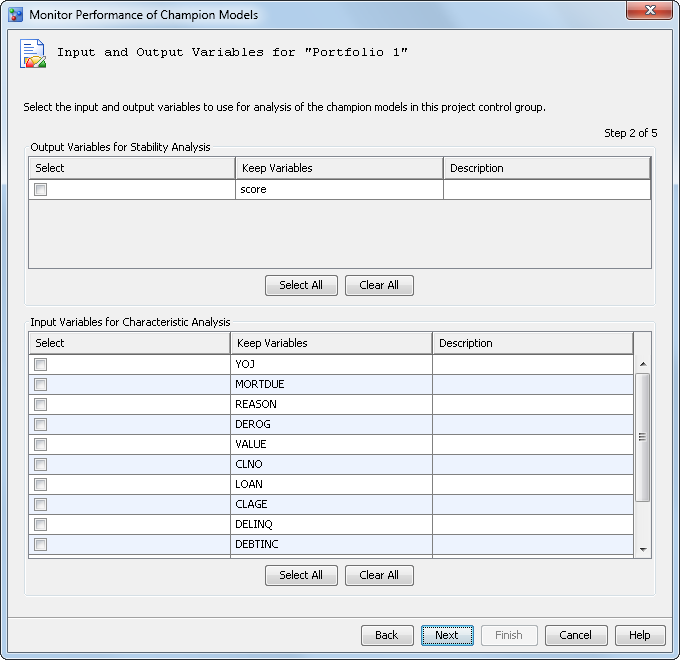
The
Input and Output Variables page appears.
-
In the
Output
Variables for Stability Analysis table, select one or
more output variables. To select all output variables, click
Select
All.
-
In the
Input
Variables for Characteristic Analysis table, select one
or more input variables. To select all input variables, click
Select
All.
Click
Next.
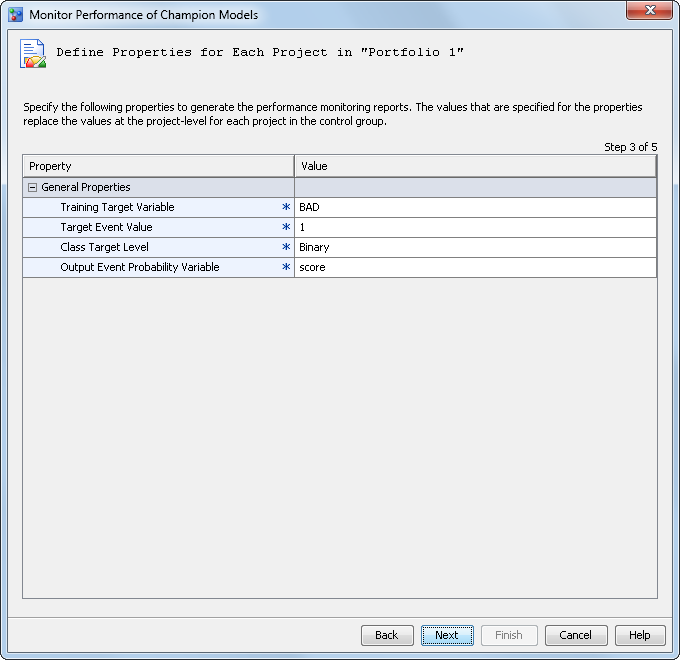
The
Define Properties for Each Project page
appears.
-
Specify the properties
that are required to generate the performance monitoring reports.
Note: The values that are specified
for the properties replace the values at the project level for each
project in the control group.
Click
Next.
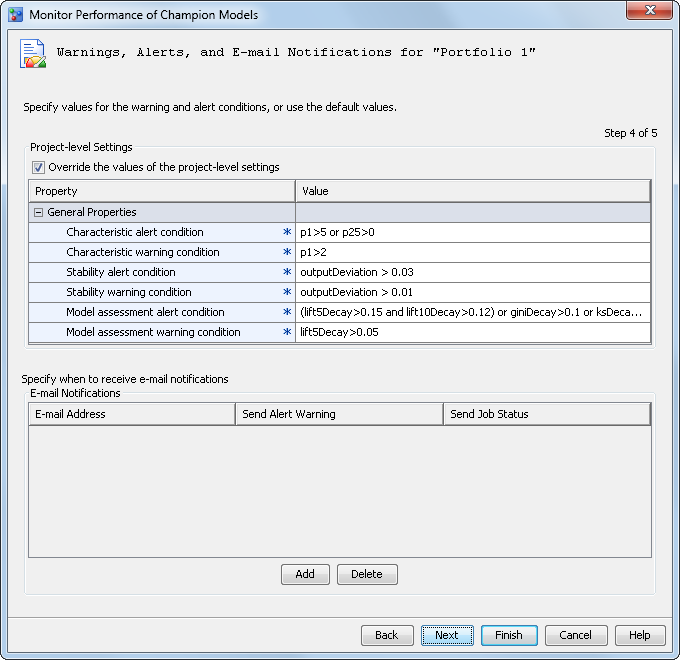
The
Warnings, Alerts, and E-mail Notifications page
appears.
-
Verify or set the condition
values for characteristic analysis, and specify when and who should
receive e-mail notifications.
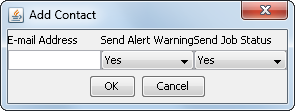
(Optional) To send the
scoring results by e-mail, click
Add in
the
E-mail Notifications table. The
Add
Contact window appears.
-
-
Select either
Yes or
No if
you want an alert warning to be sent by e-mail when alert or warning
thresholds have been exceeded.
-
Select either
Yes or
No if
you want a completion notice with the job status to be sent by e-mail
every time the report runs.
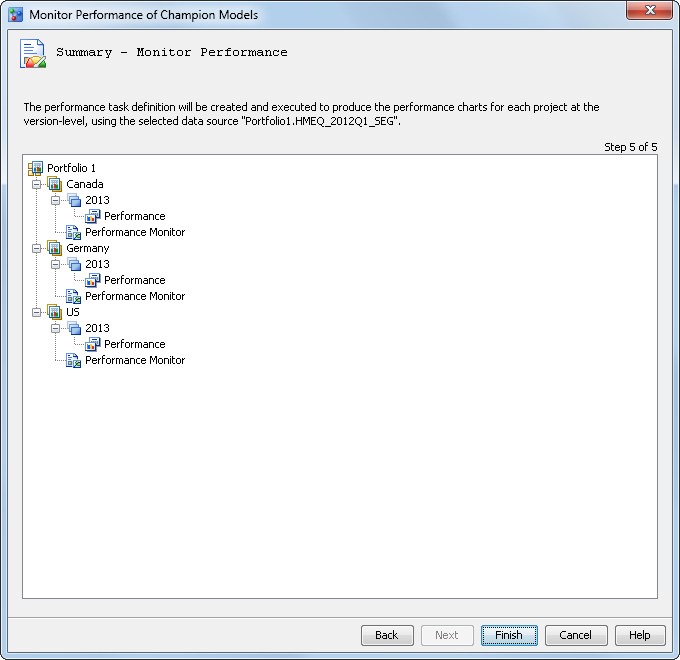
Click
Next.
The summary of the monitor performance task that has been created
is displayed.
-
Click
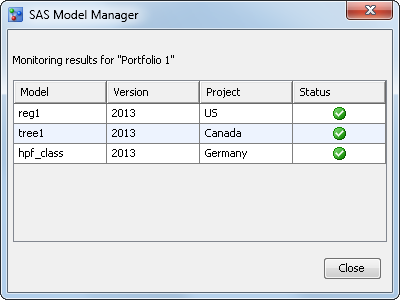
Finish.
The
Running background process status bar
appears. The generated SAS code executes automatically. When it is
finished, a status message for the monitoring results appears. Click
Close.
You can view the generated
code in the project
Performance Monitor folder
for each project within the control group.
-
To execute the generated
code again, right-click the
Performance Monitor node
in the project control group folder, and select
Execute.
The performance task is executed as a background process. SAS Model
Manager saves the data sets that create the monitoring reports in
the version
Resources folder of each project.
Note: The
Execute pop-up
menu item is available only to SAS Model Manager administrators and
advanced users.
-
(Optional) Repeat steps
1 through 7 to monitor performance of the champion models for multiple
performance data sources.
-
To view Model Monitoring
Performance reports, select the
Performance node
at the default version level for each project within the control group.
The details section displays a tab for each report. Select a tab to
see a report.