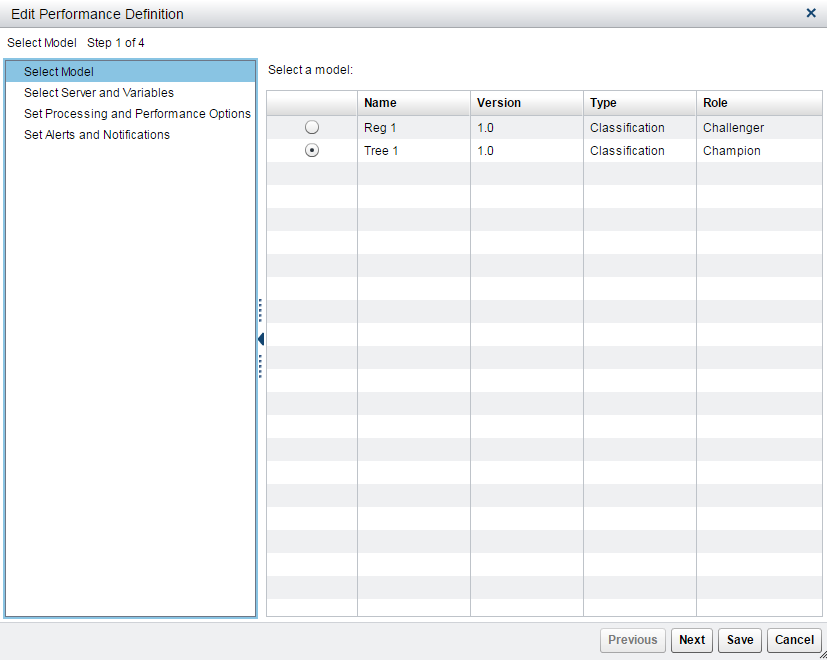
Edit and Execute a Performance Definition
To create the monitoring reports, you specify a performance definition to generate
SAS code. You then execute the generated code or create a schedule to execute the generated code on a specific
day and time. Execution of the generated code creates the SAS data sets that are used to display reports: either the monitoring reports from the version
Performance page,
or the Monitoring report or Champion and Challenger Performance report
that you create from the New Report window.
To edit the performance
definition:
-

-
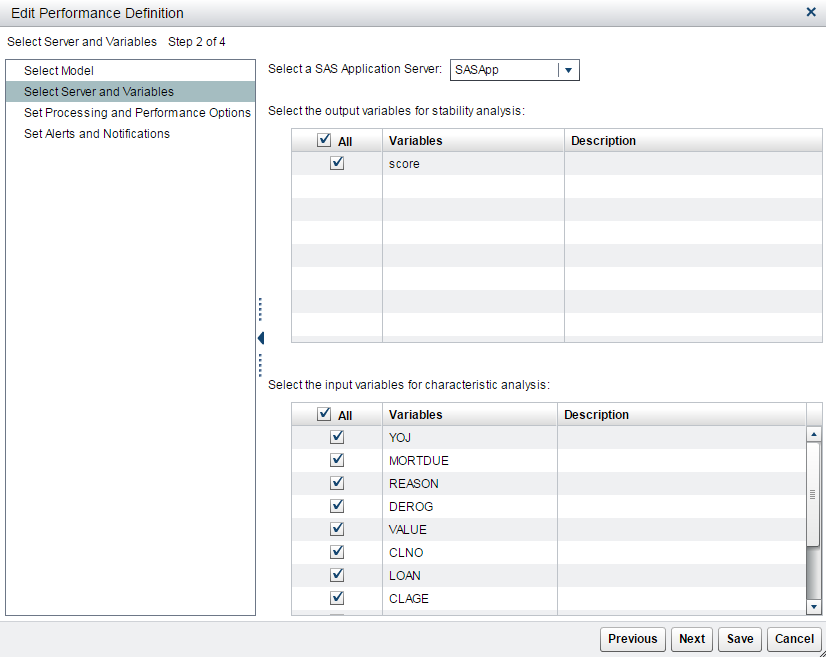
Select a SAS Application Server.
-
Select one or more output variables for stability analysis. To select all output variables, click All.
-
Select one or more input variables for characteristic analysis. To select all input variables, click All. Click Next.

-
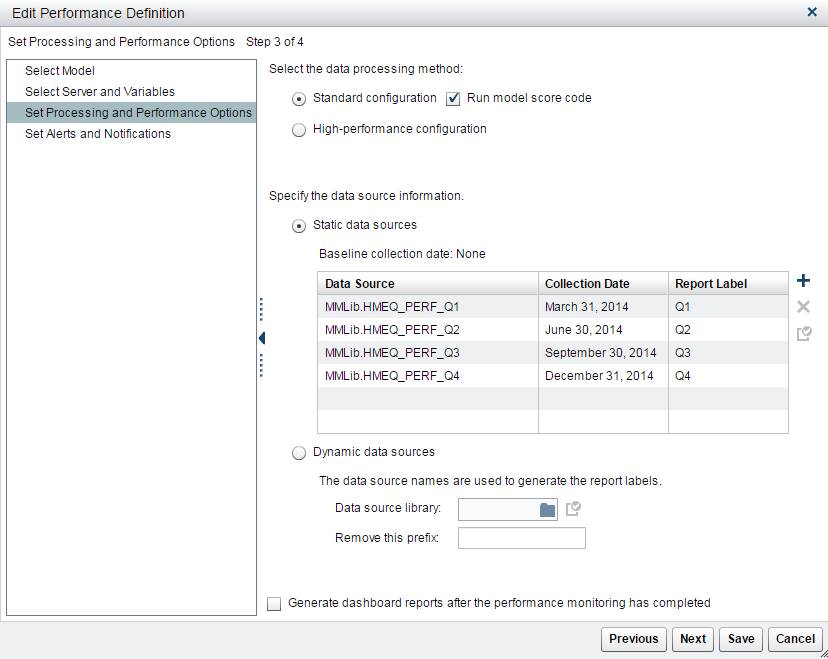
Choose the data processing method:
-
To run a standard environment, select Standard configuration.
-
To run the performance monitoring definition in a High-Performance Analytics environment, select High-performance configuration.Note: The score code is not run when High-performance configuration is selected.
-
-
Decide to use either the static or dynamic data sources, and then specify the data source information.Note: Ensure that the data source information is complete before saving the definition. If you start adding information for static data sources and then decide to use dynamic data sources instead, be sure to delete the information added for static data sources before adding the dynamic data source information, and vice versa.To use static data sources:
-
Click
 .
Note: If you are adding multiple tables in the first performance definition, the data table whose collection date is the earliest is set as the baseline performance data table.
 -
Click the empty cell in the Data Source column.
-
-
Click the empty cell in the Collection Date column and click
 . Select a date. The date can be any date in the time period when the performance
data was collected.
-
To add a label for the date, enter the label name in the Report Label column. The report label represents the time point of the performance data source. Because the report label appears in the performance charts, use a label that has not been used for another time period, is short, and is understandable (for example, Q1).Note: Duplicate report labels result in previous performance results being overwritten.
-
(Optional) Select a data source and click
 to verify that the selected input variables and target variable are included in the performance data source.
-
(Optional) Repeat the above steps to add multiple performance data sources to the performance definition.
-
(Optional) To delete a data source from the performance definition, select the data source and click
 .
.
To use dynamic data sources:-
Click
 to select a data source library.
-
(Optional) Specify the prefix to remove from the data source names in the selected library. The data source name is used for the report label. You can remove the prefix so that it does not show as part of a report label on the charts.
-
-
(Optional) Select Generate dashboard reports after the performance monitoring has completed. The dashboard definition must already exist for this option to work.

-
Click Next.
-
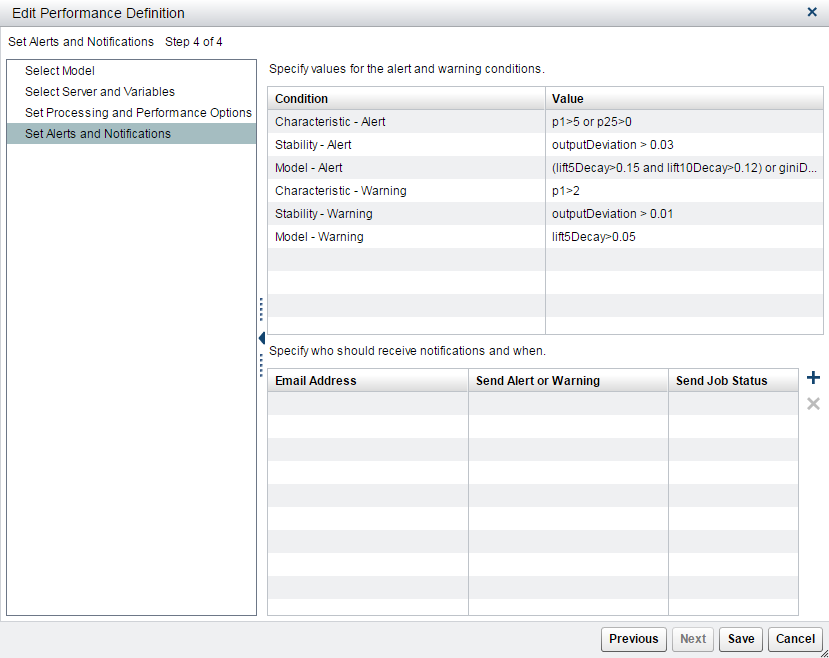
(Optional) Either specify values for the alert and warning conditions or accept the defaults.
-
(Optional) To send the results by email, click
 . A new row is added to the table.
-
Enter an email address.
-
Select either Yes or No if you want an alert or warning to be sent by email when alert or warning thresholds have been exceeded.
-
Select either Yes or No if you want a completion notice with the job status to be sent by email every time the report runs.

-
-
Click Save.
To execute a performance
definition:
-
Select the Performance page for the project.
-
Click
 .
.
-
After the performance monitoring has been completed, a confirmation message appears. Click Close.
-
Click the Results tab to view the performance results.Note: You can check the status of a job by clicking
 and then selecting the Results tab
or the Job History tab.
Note: You can overwrite or delete
previously created performance data sets.
Copyright © SAS Institute Inc. All Rights Reserved.
Last updated: February 14, 2017
