Tile charts (or treemaps)
that are created using the SAS Enterprise Guide tile chart task include
a web link to SAS IT Resource Management reports. To add a web link
to SAS IT Resource Management reports, use the servlet that SAS IT
Resource Management provides. The servlet associates the JAVA-based
tile chart classification variables with an ITRM report that has matching
BY variables.
Using the servlet, you
specify tile chart web link parameters that enable you to drill down
from that tile chart to ITRM reports that are stored on the SAS Content
Server.
To implement this feature,
perform the following steps:
-
Ensure that you have
an IT data mart that contains all of the data sources that you want
to work with.
-
Open SAS Enterprise
Guide and select the information map that you want to work with.
-
Select the tile chart
task to define the tile chart report.
-
Carefully consider the
classification variables when you are exploring the data. These values
are used to identify the ITRM reports by their BY variables that are
used for the tile chart web links.
-
From the
Properties dialog
box of the tile chart task, select
Results.
Set the graph type to
JAVA.
-
Run the report interactively
and confirm that the drill-down criteria are defined correctly.
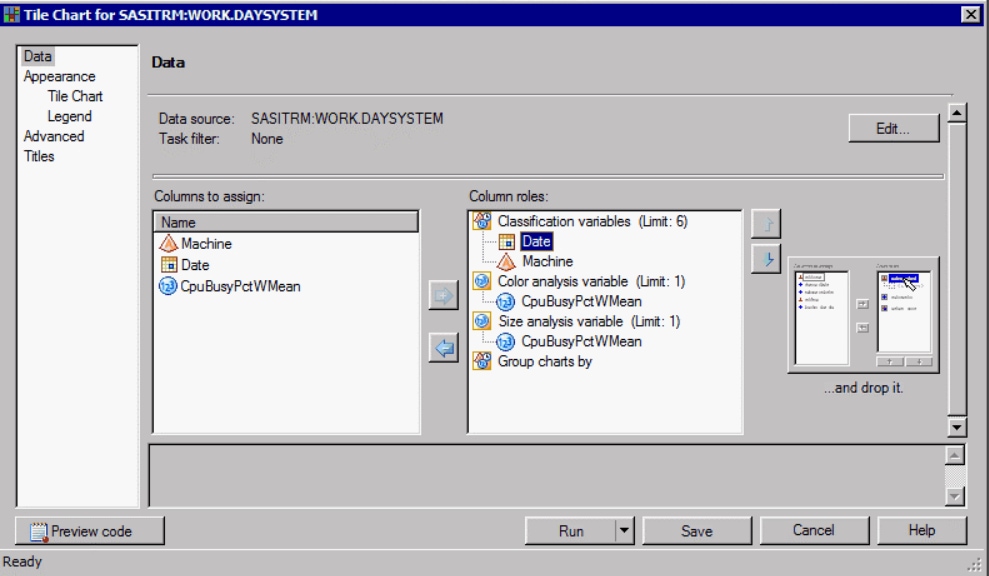
The following display
shows a tile chart task with two columns identified as classification
variables: Date and Machine.
Definition of a Tile Chart
-
Using the same information
map data source, create the report that you want to access using
web links from the tile chart:
-
The BY variables of
this report must match the class variables that were used in the tile
chart.
-
Run the report interactively
and confirm that the BY variables are defined correctly.
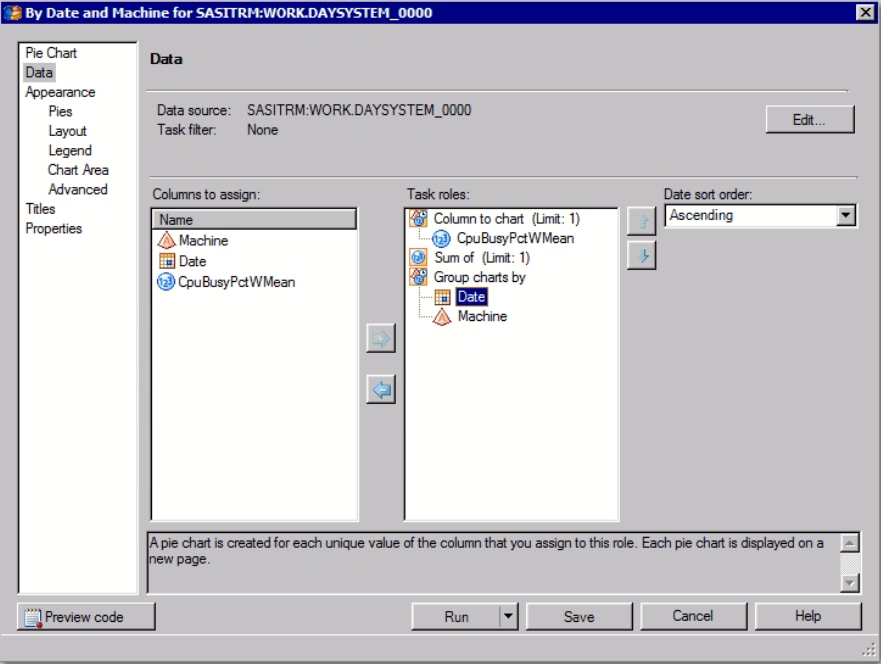
The following display
shows a pie chart task with two columns identified as BY variables:
Date and Machine.
Setting Up BY Variables: Date and Machine
-
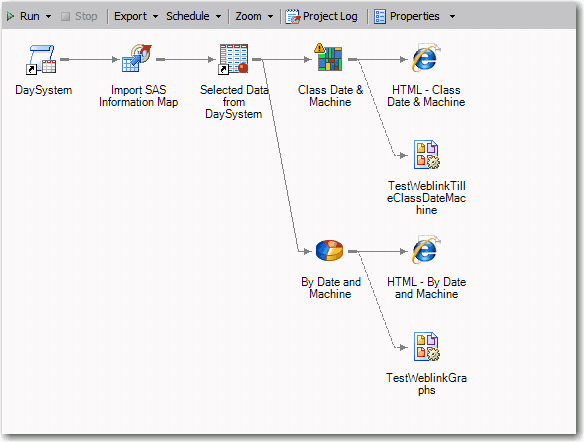
When you are satisfied
that both reports are defined correctly, add an ITRM report definition
task for each report task that you defined. In addition, create the
report definitions on the SAS Metadata Server by deploying the ITRM
report definition tasks.
Project with Web Links Graphs
-
Carefully consider the
report definition names that you specify so that they are easy to
identify because you will use them as parameter values in the servlet
provided by ITRM.
-
For the ITRM report
definition task that is associated with the tile chart, set the graph
type to
JAVA.
-
Consider using a keyword
to help easily find the reports using ITRM Report Center when verifying
the report output. You can define your own keyword for this purpose.
-
In the SAS IT Resource
Management client, create a report job to run the two report definitions
that you created in the previous steps. Run the job interactively
and confirm that the report output looks correct. You can use ITRM
Report Center to view the reports.
Note: You can use ITRM Report Center
to create a gallery from which you can view the reports.
-
When you are satisfied
that the reports that are generated by the report job are correct,
use SAS Enterprise Guide to add the web link URL to the tile chart
task and redeploy the report definition.
From the
Advanced window
of the SAS Enterprise Guide tile chart task, enter a web link label
and a URL. The web link label is displayed as the tile chart web
link. Specify the URL with the following components:
-
The middle-tier server name where
ITRM Report Center is running
-
The case-sensitive SAS IT Resource
Management servlet name
-
The case-sensitive SCSRootPath
for the SAS IT Resource Management reports to which the tile charts
link
The SCS root path consists
of the SAS
sasdav path, the
ITRM root
path, and the folder location where the web link should search for
reports.
-
One or more web link parameters
Here is an example:
-
Middle-tier server name:
http://MyMiddleTier.com
-
Servlet name:
ITRMReportCenter/weblink/externalViewReport.jsp?
-
SCSRootPath:
/SASContentServer/repository/default/sasdav/ITRMRoot/DataMartName_JobName/ITRMReportDefinitionName
-
Classification and BY variable
names (for example, &VariableName1={&1} &VariableName2={&2})
The previous instructions
yield this URL:
http://MyMiddleTier.com/ITRMReportCenter/weblink/externalViewReport.jsp?SCSRootPath=/SASContentServer/repository/default/sasdav/MyRoot/MyDataMart_MyJob/MyReportDefinition&VariableName1={&1}&VariableName2={&2}
-
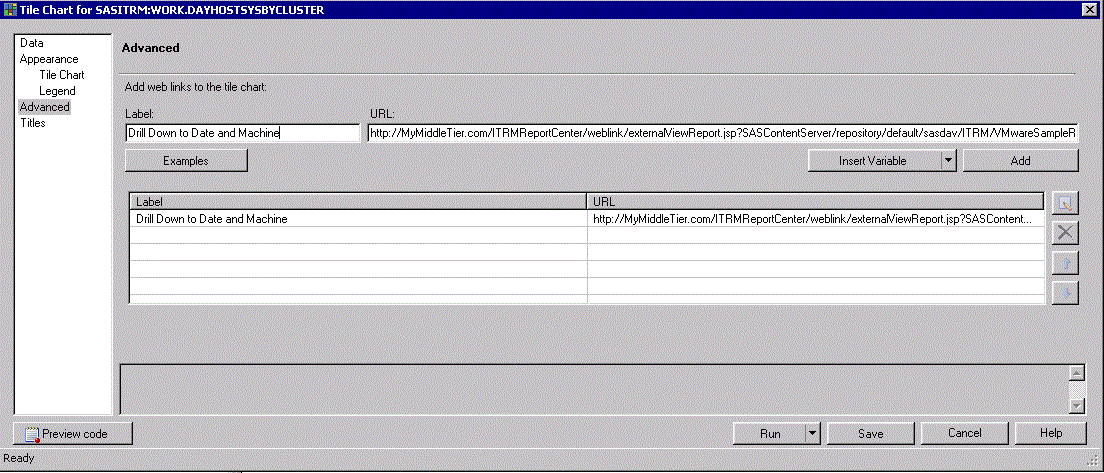
The following display
shows the
Advanced dialog box for the tile
chart task where the information from the previous step is entered:
Dialog Box with Updated URL
-
Each SAS Enterprise
Guide tile chart with a unique set of web links must be associated
with its own report definition. In other words, the following statements
apply:
-
A tile chart task can have more
than one web link.
-
All tile charts that are associated
with a report definition must share the same (one or more) web links.
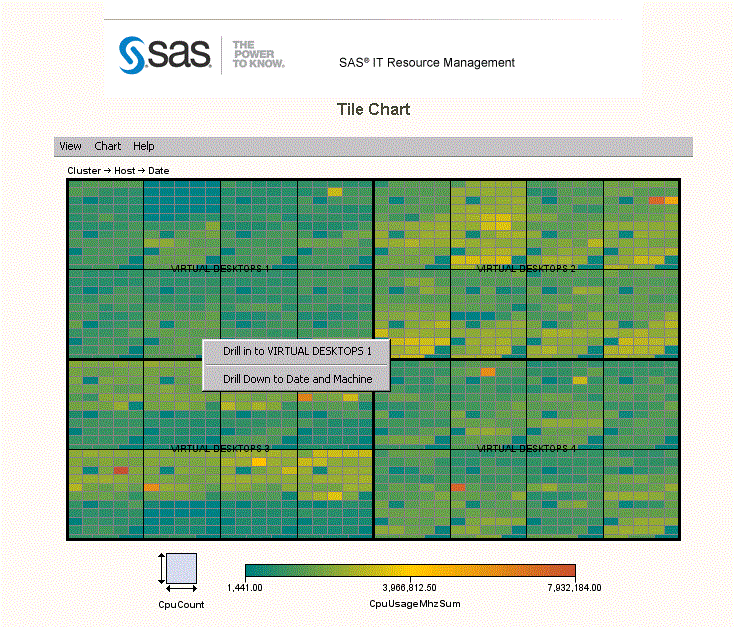
The following display
shows the resulting tile chart with the web link enabled. When you
are right-clicking a tile, the web link launches the SAS IT Resource
Management bar chart that meets the established criteria.
Tile Chart with Web Links Enabled
