Features of ITRM Report Center
How to Organize Reports
You can organize SAS
IT Resource Management reports with the following components:
-
Albums are containers for reports to which you want easy access. They can be thought of as point-and-click galleries. When you open an album, it resembles and behaves like a gallery. Galleries and albums differ only in how they are created. An album is created by selecting reports from existing galleries and using the Copy Link to Album icon (
 ) that is available from the workspace bar. You do
not use a wizard to create or edit it.
-
A gallery is a group of reports that share common filter values. You can organize SAS IT Resource Management reports by creating a gallery that includes all of the reports that meet a specific criterion. For example, you might create a gallery to include all available reports for a particular machine, adapter data source, or keyword.ITRM Report Center also enables you to further subset or filter the reports in a gallery when viewing that gallery. Thus, you can quickly view a smaller set of reports in a gallery to measure and analyze the utilization, availability, performance, and statistical trends of IT resources for your enterprise.
-
A gallery folder is a container for galleries, albums, and other gallery folders. These folders function like typical folders in a tree. You can use these folders to group related galleries, albums, and gallery folders. For example, you might create a single gallery folder to include all of your galleries for DT Perf Sentry reports.
How to View Reports
In ITRM Report Center,
the Gallery and Resource workspaces
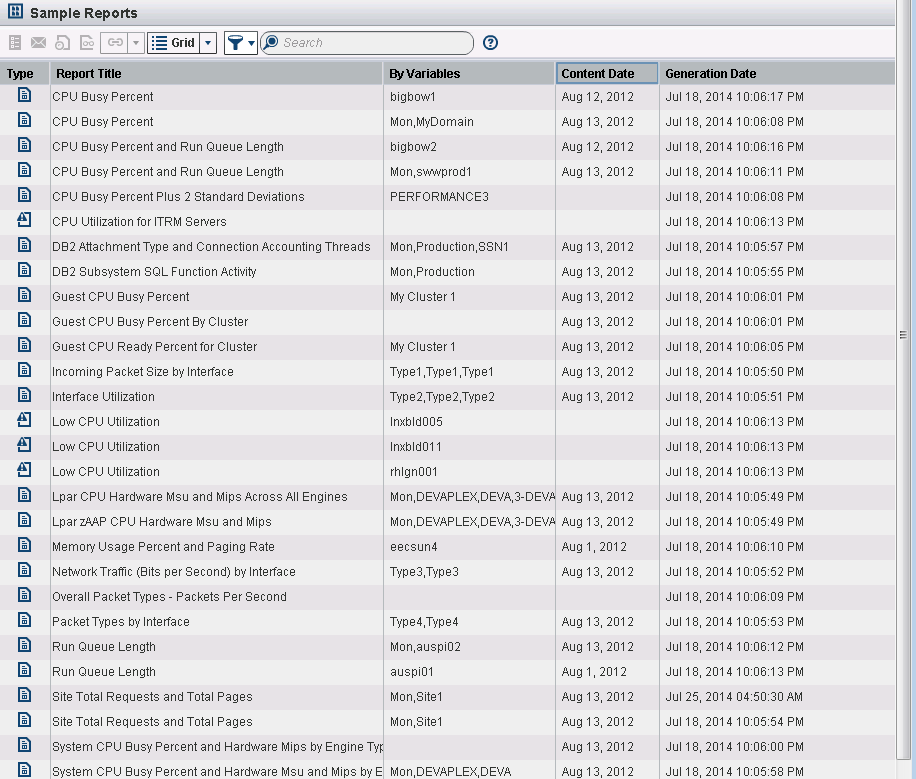
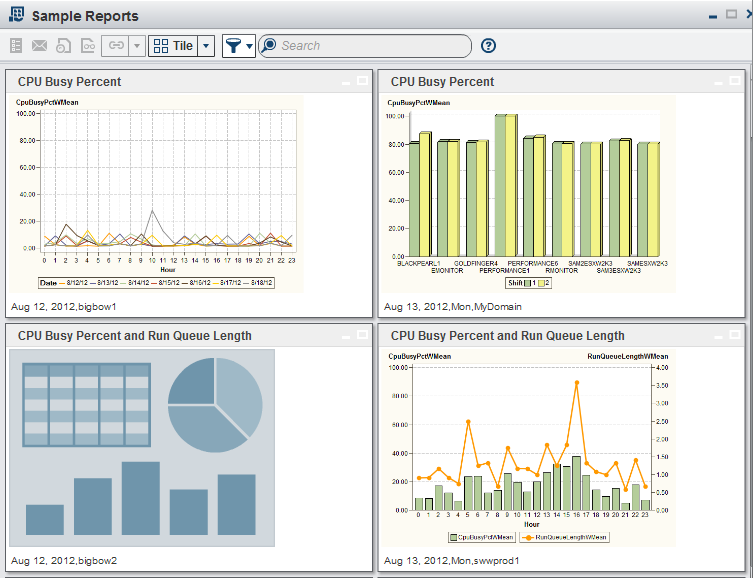
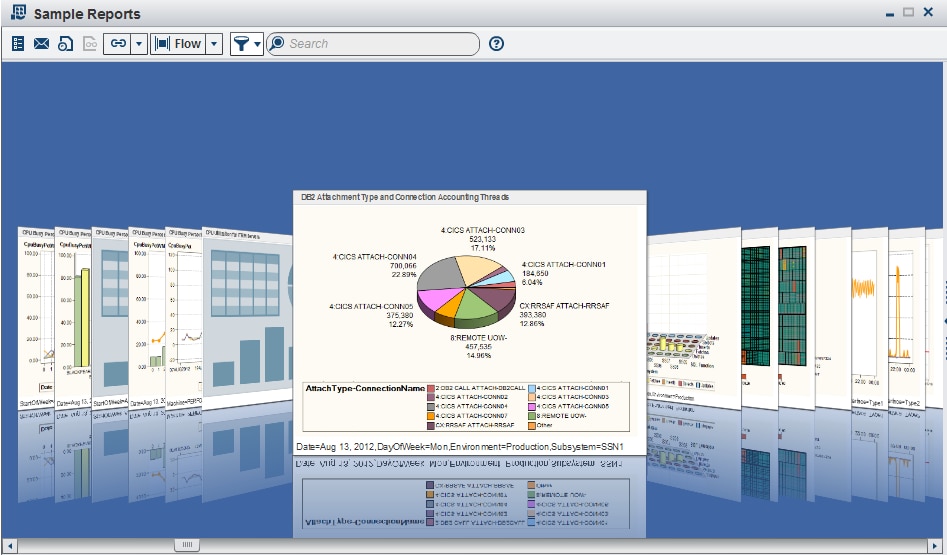
provide four views of the reports that you select. Use the arrow
on the taskbar to select the type of display that you want to view.
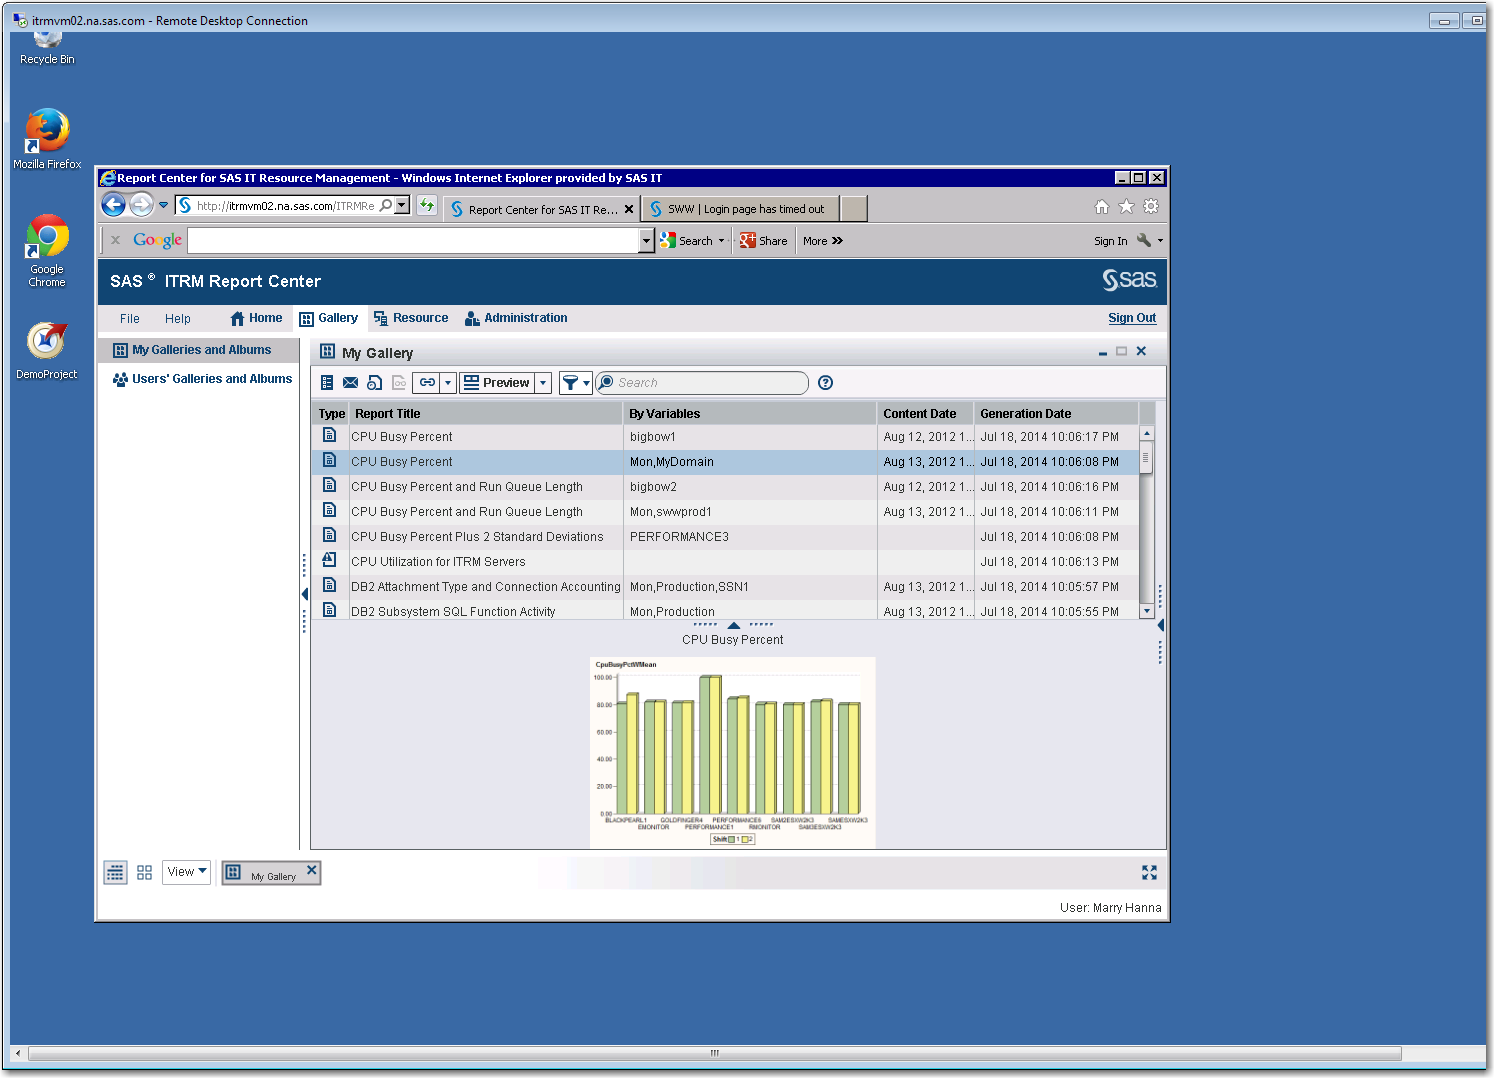
In the following display, My Gallery is opened
and the CPU Busy Percent and Run Queue Length report
is selected. The flow view is chosen as the format in which to view
the report.
Copyright © SAS Institute Inc. All rights reserved.


