Overview of SAS BI Dashboard
About SAS BI Dashboard
Dashboards provide a
way to view data. Users can quickly view critical information in a
compact, easy to interpret interface. Dashboards can display key performance
indicators in one place to help users monitor information throughout
an enterprise. By using the new dashboard designer and dashboard viewer,
you can create a single dashboard that contains multiple indicators
instead of creating a portal page with multiple dashboard portlets.
Coordinating the look and feel of your dashboard and indicators is
easier than ever.
A dashboard is a container
that is nested within a portlet and that contains one or more indicators.
An indicator is a composite of one or more related objects. Each indicator
has a data source, one or more gauges, hyperlinks to additional information,
and range settings for the gauges. Dashboards display critical information
in such a way that the information can be interpreted and monitored
at a glance. Dashboards can also contain links to other pertinent
information, important summary and highlights, and personalized information
such as weather, news, and stock news. Here is an example dashboard
that contains three dashboards that use different data sources:
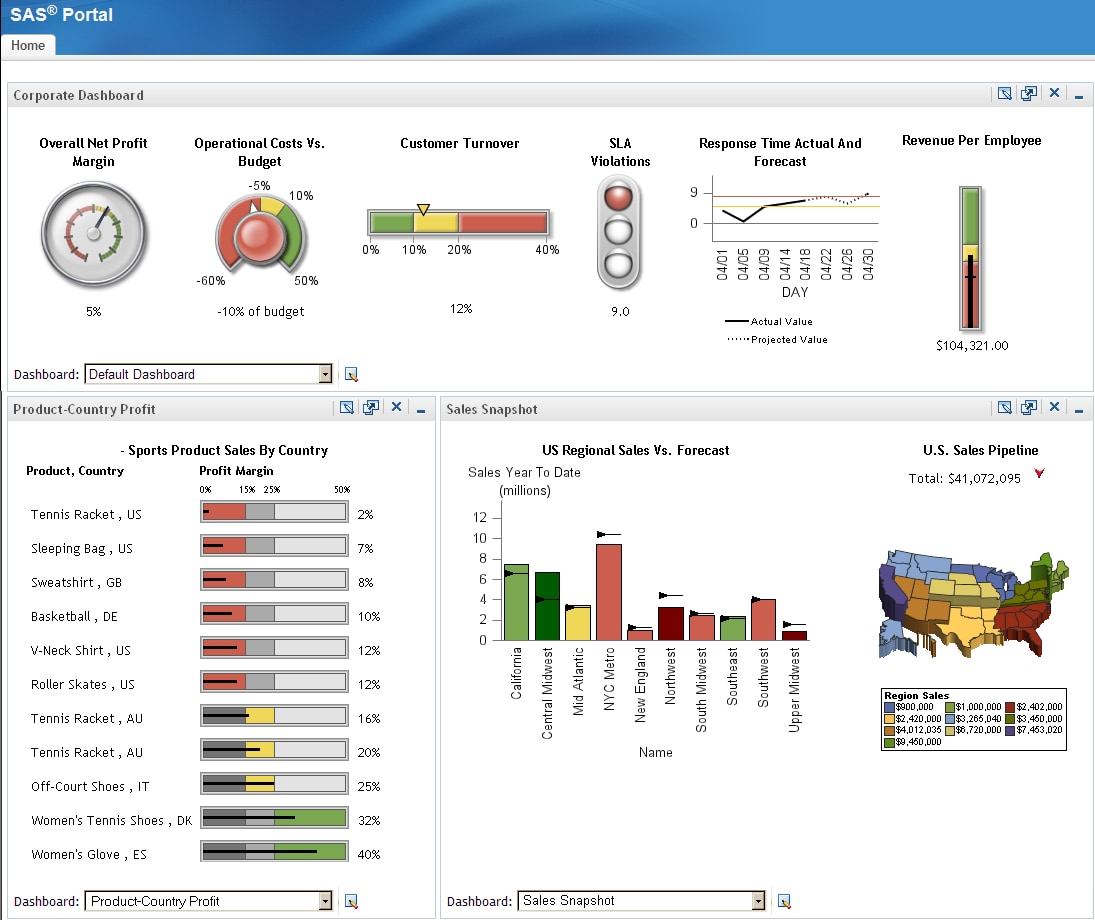
The SAS BI Dashboard
enables users to use dashboards to monitor key performance indicators
that convey how well an organization is performing. As shown in the
preceding display, dashboards include graphics, text, colors, and
hyperlinks. The preceding dashboard shows multiple indicators, each
with its own data model underneath. These indicators are driven by
six different SQL queries, but the data models could be all information
maps, all scorecards, or some combination of these types. This dashboard
displays gauges, graphs, bar charts, line plots, and a map.
Dashboards are created,
maintained, and viewed through an easy-to-use Web-based interface.
All content is displayed in a role-based, secure, customizable, and
extensible environment. Information consumers and performance analysts
can customize how information appears on their personal dashboards.
SAS BI Dashboard enables
users to create their own dashboards from a variety of data sources,
including information maps and SAS data sets. Users can link dashboards
to SAS business intelligence objects or to external URLs, and users
can customize the visualization of the data in a number of ways. For
more information about the SAS BI Dashboard, see the SAS
BI Dashboard: User's Guide.
Log On to SAS BI Dashboard
The SAS BI Dashboard is accessed from
within the SAS Information Delivery Portal. The current logon information
from the portal is provided to the SAS BI Dashboard. Therefore, the
SAS BI Dashboard appears immediately, without the need to log on.
For more information, see the Help for SAS Information Delivery Portal.
To access SAS BI Dashboard,
open the SAS Information Delivery Portal and log on. To do so, perform
the following steps: