Working with the ITRM Gallery Task
Access and Navigate the ITRM Gallery Task
To navigate through
the pages of the ITRM Gallery task, use the following buttons:
saves the current specifications
set in the ITRM Gallery task and creates an ITRM Gallery task object
in the process flow diagram of the SAS Enterprise Guide project. The
save option does not create a report definition. It simply saves the
ITRM Gallery task object that you can use to create a report definition.
Create Report Definitions Using the ITRM Gallery Task
To name and define
report definitions for a SAS Enterprise Guide project, perform the
following steps:
-
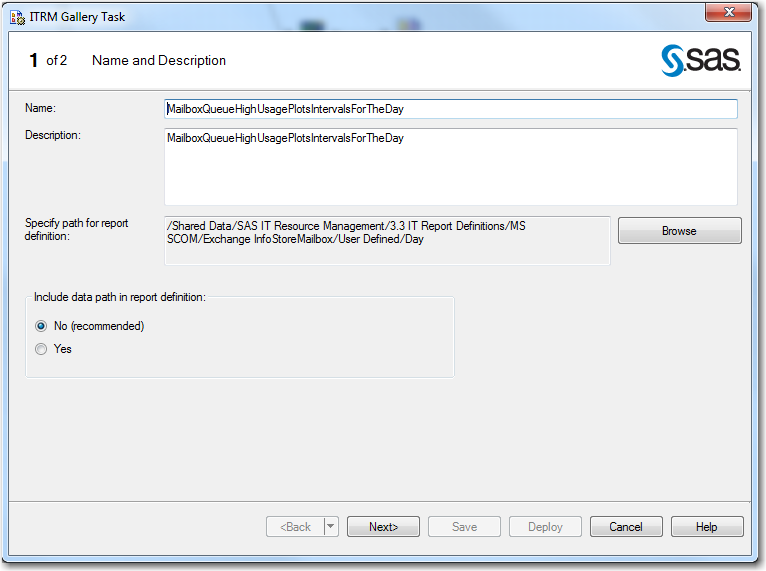
In the Name field, enter the name of the ITRM Gallery task. This is the name that the ITRM Gallery task assigns to the report definition that it creates. The name must be unique for the current metadata path, or the new ITRM Gallery task will overwrite the report definition that has the same name. The Name field can contain no more than 60 characters.Note: SAS IT Resource Management supplies sample projects that name ITRM Gallery task objects and report definitions by using descriptive words that indicate the following: the measures that are reported, the filters that are used, and the time period that is reported. For example, a report definition might be named SystemCpuHighUsagePlotIntervalsForTheDay. For best results, use this naming convention or your own to create consistent names that are easy to understand and locate in the SAS Metadata Server.
-
In the Specify path for report definition field, specify a metadata path where you want to save the report definition. Click Browse to select the folder that you want to contain the report definition for the reports that are included in the ITRM Gallery task.The metadata folder that you select resides in the SAS Metadata Repository and is available from the SAS IT Resource Management client. The folder that you select will contain the report definitions for the reports that are included in the ITRM Gallery task.For best results, save your report definitions in
/Shared Data/SAS IT Resource Management/<SAS IT Resource Management version number> IT Report Definitions/<adapter>/<domain category>/User Defined/<time period>.CAUTION:Do not save your user-defined report definitions in the folder that is named Supplied in the preceding path.The Adapter Setup wizard uses the report definitions in theSuppliedfolder when generating reporting jobs. If you add or modify report definitions in theSuppliedfolder, then the associated Adapter Setup wizard jobs might lose the IT intelligence that SAS IT Resource Management provides. Your modified report definitions might also be overwritten when you install any software updates for SAS IT Resource Management. -
Use the Include data path in report definition option to enable or disable the storing of the current data path in the report definition. The default and recommended value is
Nobecause it provides greater flexibility and portability of report definitions. In this case, the data path value in the report definition is left blank, and the Gallery transformation that uses the report definition will search for the data within the corresponding folder for the given job.TheYesvalue indicates that the report definition explicitly specifies the data path as the current data path that was used when the report definition was created. SelectYesonly if your data path is unique, unchanging, and outside the job folder for the report definition. The Gallery transformation that uses the report definition will then search for the data within the same data path that was used when the report definition was created.For more information, see Specifying a Data Source Location. -
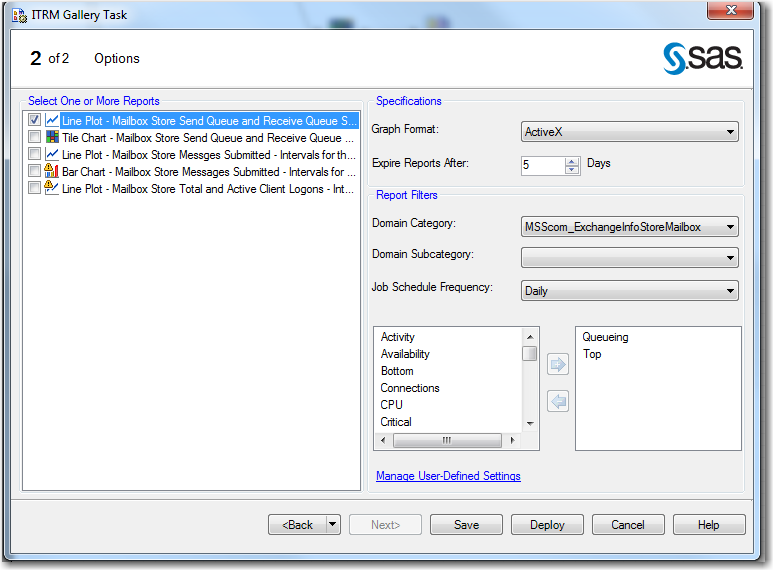
On the Options page, you must select one or more reports from the list of report tasks that are in the current process flow. All of the reports that you select will use the same specifications and report filter settings.Note: If you want to assign different settings to various reports, you must create a separate ITRM Gallery task. For example, line plots use the graph format of ActiveX for dynamic features while tile charts are most useful when Java is used. If you have a project that includes both line plots and tile charts, then you perform the following steps:
-
calculates the expiration date, relative to the system date at the time that the report is generated. If a report is expired and its report job is run again, the expired report is deleted and replaced with the new report. If a report is not expired and its report job is run again, the previous report remains in the system with the new report that is generated. You can specify an expiration range from 1 to 999 days. The default value is
1. In this case, reports that are older than one day are deleted when the report job is run.Note: This parameter calculates expiration by number of days. When setting the expiration for reports that are run on a schedule other than daily, account for the number of days within the time period in which the reports are run. For example, the expiration value for a weekly report should be some multiple of seven because there are seven days in a week. -
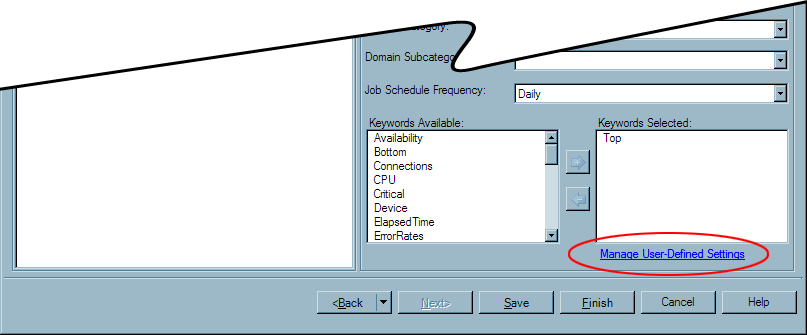
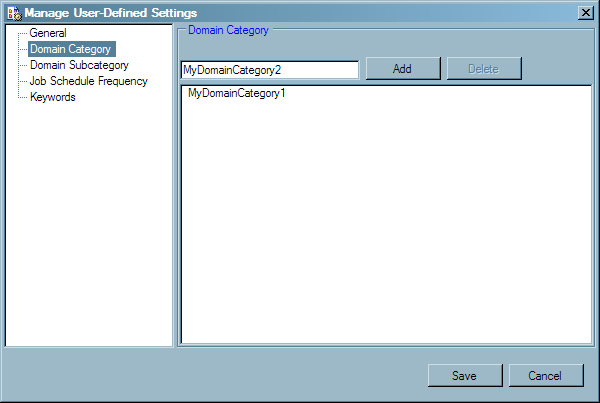
In the Report Filters box, specify the filter values that you want to use when viewing reports in the Gallery Manager. These values do not appear on the report. However, they do appear as filter options in the Gallery Manager.The options for each filter type can include supplied values and user-defined values. To create, delete, save, or share user-defined values for the filter types, click Manage User-Defined Settings. For more information about managing user-defined values, see Managing User-Defined Settings for Report Filters.CAUTION:Carefully select the appropriate filters for your reports and ensure that you use correct spellings for user-defined values.Assigning an incorrect or misspelled filter to a report does not affect the data or the accuracy of the report content. However, an incorrect filter makes the corresponding report difficult to locate when filtering subsets of reports in the Gallery Manager. In addition, make sure that the values for each of the filters are less than 33 characters in length.specifies the adapter and domain category that you assign to the reports for filtering in the Gallery Manager. The options for this field include the values for the adapters that the Adapter Setup wizard supports as well as any user-defined values. The values are sorted alphabetically in this list. For best results, do not leave this field blank.specifies the report category, a subset of the domain category that you selected. The options for this field include only the subcategories for the domain category that you selected as well as any user-defined values. If the Domain Category value is blank or if the supplied domain category does not include supplied subcategories, then only the user-defined values for domain subcategory are available.indicates when the corresponding reports should be scheduled to run and specifies the time period that you assign to the reports for filtering in the Gallery Manager. The options for this field include daily, weekly, monthly, quarterly, yearly, and any user-defined values.Note: This value is a report filter in metadata only. It does not schedule report jobs. You can use this value as an indicator to include this report definition in report jobs that are scheduled to run on an interval that corresponds with this value. This value is also used as a filter in Gallery Manager.lists the keywords that you can assign to reports for filtering in the Gallery Manager. This list includes supplied and user-defined keywords. To add keywords to reports, select one or more keywords from the Keywords Available list and then click
 . The keywords are added to the Selected
Keywords list. To remove keywords from the Selected
Keywords list, select one or more variables from the Selected
Keywords list and click
. The keywords are added to the Selected
Keywords list. To remove keywords from the Selected
Keywords list, select one or more variables from the Selected
Keywords list and click  .
.
-
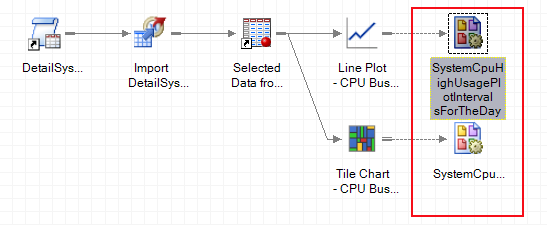
Click Finish. All values are saved in the ITRM Gallery task object, a report definition is created on the metadata server, and an ITRM Gallery task object appears in the process flow diagram with a link to all of the selected reports tasks and program nodes. A message box notifies you when the report definition is created successfully.CAUTION:Running a SAS Enterprise Guide process flow or project does not automatically run the ITRM Gallery task and create a report definition.When a report definition is created successfully, it does not appear as a separate object in the process flow or in a format that is viewable from SAS Enterprise Guide. SAS Enterprise Guide manages the ITRM Gallery tasks that create report definitions but it does not manage the report definitions. You can use SAS IT Resource Management and SAS Management Console to view and access the report definitions that the ITRM Gallery tasks create.
CAUTION:
Do not
create multiple ITRM Gallery tasks in a single process flow and then
use the report definitions that they create in multiple report jobs
that are run in parallel.
Report jobs save reports
in root folders of the SAS Content Server that are named according
to the corresponding project name and process flow name. If separate
jobs attempt to update the same root level folders at the same time,
then a conflict can occur. For example, do not create daily and weekly
report definitions in a single process flow and then create daily
and weekly report jobs that run in parallel.
Managing User-Defined Settings for Report Filters
About the Manage User-Defined Settings Window
When planning
to filter and subset your reports, you might need to create domain
categories and keyword values that are unique to your business. The
ITRM Gallery task enables you to create and manage your own unique
filter values that you can assign to report definitions and use later
in the Gallery Manager when viewing and searching for reports. You
can also share these user-defined filters with other clients that
might want to filter reports in a similar way.
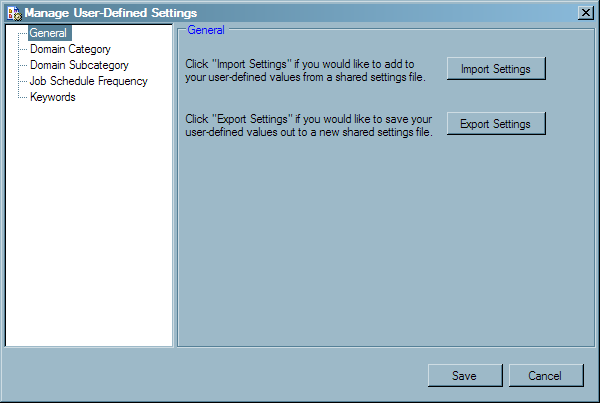
The Manage
User-Defined Settings window of the ITRM Gallery task
enables you to share, add, and delete user-defined values for report
filters. The user-defined values that you specify on this window are
then available from the Gallery Manager and for report definitions
that are created with an ITRM Gallery task in SAS Enterprise Guide.
Create User-Defined Values
-
Enter the new filter value in the field at the top of the window. This field accepts only letters, numbers, hyphens, and underscores.Note: Misspellings, typing errors, and differences in capitalization standards can create inconsistencies in this field. An error in the value can make the associated reports difficult to find when using the Gallery Manager to filter your reports. Inconsistencies can also lead to multiple filter values that mean the same thing but are listed separately.
Delete User-Defined Values
When you
delete a user-defined value, the value is removed from the list of
available filters in an ITRM Gallery task. If an ITRM Gallery task
uses the deleted value, then the setting is replaced with a blank
value the next time you open the ITRM Gallery task. However, the deleted
value will still be available for selection in the Gallery Manager
until all of the reports that include the deleted value are purged
from the SAS Content Server. It will also still be in the metadata
of report definitions and report output that were generated before
the change.
Modify Report Definitions Using the ITRM Gallery Task
You can use the ITRM Gallery
task to modify a SAS IT Resource Management report definition. The
ITRM Gallery task must be run manually (as described in this topic)
to create or modify a report definition. Simply running a project,
process flow, or a branch in SAS Enterprise Guide does not update
the report definitions.