Standards for SAS IT Resource Management Report Elements
Titles
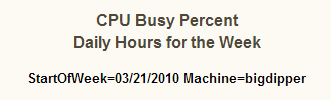
The following figure
provides an example of Title1 and Title2 in a SAS IT Resource Management
report with a BY Line.
Titles and BY Line in a SAS IT Resource Management Report
The following table
provides information about how Title2 standards map to the aggregation
level for the report.
Footnotes
Axis
Colors
A template named ITRMDefault is used for default colors in SAS IT Resource Management reports.
However, most reports do not require that colors be specified explicitly
in the report task.
Most of the colors that
are defined in the ITRMDefault template were selected from the autumn color scheme and from a set
of the SAS Enterprise Guide window default
colors.