Monitoring Ranks
What is a Rank?
Monitoring Ranks across Machines
From the Jobs window,
select a job in the list, right-click, and select Show
Ranks. A window that is similar to the following example
appears.
Ranks in a Server
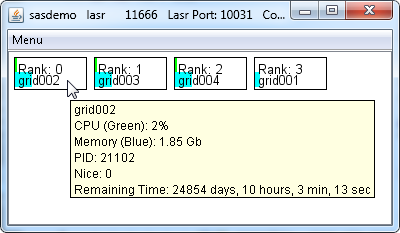
From this view, you
can see that a server is using four machines. The tooltip shows the
CPU and memory usage for the process on an individual machine. You
can also see that grid001, the root node, is using less memory than
the other three machines because the blue bar is shorter. This is
normal because the root node of a server does not hold any rows of
data from a table.
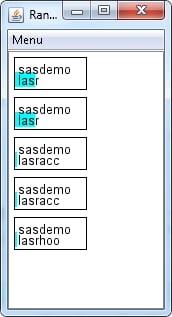
Monitoring Ranks on One Machine
From the Grid
Monitor window, select a node icon, right-click, and
select Show Ranks on Node. A window that
is similar to the following example appears. The following display
was made narrow so that the processes would stack vertically. This
is to highlight that the processes are running on a single machine,
similar to the list of jobs on the Jobs window.
Ranks on One Machine
About Scaling
Both views of ranks,
whether for process across machines, or all the processes on one machine
offer a menu choice for scaling CPU usage. The settings are as follows:
For example, on a machine
with 12 cores that use Intel Hyper-Threading Technology, a server
starts 24 threads. If the server runs a single-threaded task on that
machine, and the setting is One CPU, then
the green bar extends the full width of the node icon and the machine
appears to be fully utilized. However, if the setting is Full
Node, then the green bar is 1/24th full and CPU usage
might be difficult to notice.
Copyright © SAS Institute Inc. All rights reserved.