Traditional Graphics in the IML Procedure
Example 17.3 Fisher’s Iris Data
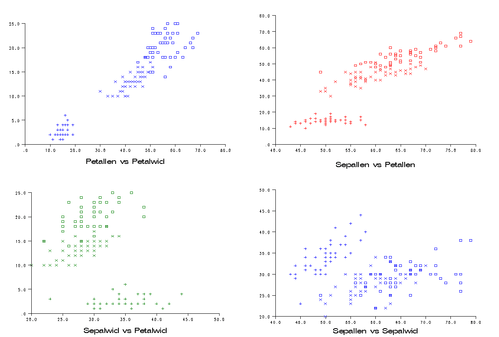
This example generates four scatter plots and prints them on a single page. Scatter plots of sepal length versus petal length, sepal width versus petal width, sepal length versus sepal width, and petal length versus petal width are generated. The following code produces Output 17.3.1.
   data iris;
      title 'Fisher (1936) Iris Data';
      input sepallen sepalwid petallen petalwid spec_no @@;
      if spec_no=1 then species='setosa    ';
      if spec_no=2 then species='versicolor';
      if spec_no=3 then species='virginica ';
      label sepallen='sepal length in mm.'
            sepalwid='sepal width  in mm.'
            petallen='petal length in mm.'
            petalwid='petal width  in mm.';
      datalines;

    50 33 14 02 1 64 28 56 22 3 65 28 46 15 2
    67 31 56 24 3 63 28 51 15 3 46 34 14 03 1
    69 31 51 23 3 62 22 45 15 2 59 32 48 18 2
    46 36 10 02 1 61 30 46 14 2 60 27 51 16 2
    65 30 52 20 3 56 25 39 11 2 65 30 55 18 3
    58 27 51 19 3 68 32 59 23 3 51 33 17 05 1
    57 28 45 13 2 62 34 54 23 3 77 38 67 22 3
    63 33 47 16 2 67 33 57 25 3 76 30 66 21 3
    49 25 45 17 3 55 35 13 02 1 67 30 52 23 3
    70 32 47 14 2 64 32 45 15 2 61 28 40 13 2
    48 31 16 02 1 59 30 51 18 3 55 24 38 11 2
    63 25 50 19 3 64 32 53 23 3 52 34 14 02 1
    49 36 14 01 1 54 30 45 15 2 79 38 64 20 3
    44 32 13 02 1 67 33 57 21 3 50 35 16 06 1
    58 26 40 12 2 44 30 13 02 1 77 28 67 20 3
    63 27 49 18 3 47 32 16 02 1 55 26 44 12 2
    50 23 33 10 2 72 32 60 18 3 48 30 14 03 1
    51 38 16 02 1 61 30 49 18 3 48 34 19 02 1
    50 30 16 02 1 50 32 12 02 1 61 26 56 14 3
    64 28 56 21 3 43 30 11 01 1 58 40 12 02 1
    51 38 19 04 1 67 31 44 14 2 62 28 48 18 3
    49 30 14 02 1 51 35 14 02 1 56 30 45 15 2
    58 27 41 10 2 50 34 16 04 1 46 32 14 02 1
    60 29 45 15 2 57 26 35 10 2 57 44 15 04 1
    50 36 14 02 1 77 30 61 23 3 63 34 56 24 3
    58 27 51 19 3 57 29 42 13 2 72 30 58 16 3
    54 34 15 04 1 52 41 15 01 1 71 30 59 21 3
    64 31 55 18 3 60 30 48 18 3 63 29 56 18 3
    49 24 33 10 2 56 27 42 13 2 57 30 42 12 2
    55 42 14 02 1 49 31 15 02 1 77 26 69 23 3
    60 22 50 15 3 54 39 17 04 1 66 29 46 13 2
    52 27 39 14 2 60 34 45 16 2 50 34 15 02 1
    44 29 14 02 1 50 20 35 10 2 55 24 37 10 2
    58 27 39 12 2 47 32 13 02 1 46 31 15 02 1
    69 32 57 23 3 62 29 43 13 2 74 28 61 19 3
    59 30 42 15 2 51 34 15 02 1 50 35 13 03 1
    56 28 49 20 3 60 22 40 10 2 73 29 63 18 3
    67 25 58 18 3 49 31 15 01 1 67 31 47 15 2
    63 23 44 13 2 54 37 15 02 1 56 30 41 13 2
    63 25 49 15 2 61 28 47 12 2 64 29 43 13 2
    51 25 30 11 2 57 28 41 13 2 65 30 58 22 3
    69 31 54 21 3 54 39 13 04 1 51 35 14 03 1
    72 36 61 25 3 65 32 51 20 3 61 29 47 14 2
    56 29 36 13 2 69 31 49 15 2 64 27 53 19 3
    68 30 55 21 3 55 25 40 13 2 48 34 16 02 1
    48 30 14 01 1 45 23 13 03 1 57 25 50 20 3
    57 38 17 03 1 51 38 15 03 1 55 23 40 13 2
    66 30 44 14 2 68 28 48 14 2 54 34 17 02 1
    51 37 15 04 1 52 35 15 02 1 58 28 51 24 3
    67 30 50 17 2 63 33 60 25 3 53 37 15 02 1
   ;

   proc iml;

   use iris; read all;

      /*------------------------------------------------------  */
      /*  Create 5 graphs, PETAL, SEPAL, SPWID, SPLEN, and ALL4 */
      /*   After the graphs are created, to see any one, type   */
      /*               CALL GSHOW("name");                      */
      /*   where name is the name of any one of the 5 graphs    */
      /* -----------------------------------------------------  */

   call gstart;                 /*-- always start with GSTART --*/

      /*-- Spec_no is used as marker index, change 3 to 4 */
      /*-- 1 is + , 2 is x, 3 is *, 4 is a square -------------*/
   do i=1 to 150;
      if (spec_no[i] = 3) then spec_no[i] = 4;
   end;

      /*-- Creates 4 x-y plots stored in 4 different segments */

      /*-- Creates a segment called petal, petallen by petalwid --*/
   call gopen("petal");
      wp = { -10 -5, 90 30};
      call gwindow(wp);
      call gxaxis({0 0}, 75, 6,,,'5.1');
      call gyaxis({0 0}, 25, 5,,,'5.1');
      call gpoint(petallen, petalwid, spec_no, 'blue');
      labs = "Petallen vs Petalwid";
      call gstrlen(len, labs,2, 'swiss');
      call gscript(40-len/2,-4,labs,,,2,'swiss');
      /*-- Creates a segment called sepal, sepallen by sepalwid --*/
   call gopen("sepal");
      ws = {35 15 85 55};
      call gwindow(ws);
      call gxaxis({40 20}, 40, 9, , ,'5.1');
      call gyaxis({40 20}, 28, 7, , ,'5.1');
      call gpoint(sepallen, sepalwid, spec_no, 'blue');
      labs = "Sepallen vs Sepalwid";
      call gstrlen(len, labs,2, 'swiss');
      call gscript(60-len/2,16,labs,,,2,'swiss');

      /*-- Creates a segment called spwid, petalwid by sepalwid --*/
   call gopen("spwid");
      wspwid = { 15 -5 55 30};
      call gwindow(wspwid);
      call gxaxis({20 0}, 28, 7,,,'5.1');
      call gyaxis({20 0}, 25, 5,,,'5.1');
      call gpoint(sepalwid, petalwid, spec_no, 'green');
      labs = "Sepalwid vs Petalwid";
      call gstrlen(len, labs,2,'swiss');
      call gscript(35-len/2,-4,labs,,,2,'swiss');

      /*-- Creates a segment called splen, petallen by sepallen --*/
   call gopen("splen");
      wsplen = {35 -15 85 90};
      call gwindow(wsplen);
      call gxaxis({40 0}, 40, 9,,,'5.1');
      call gyaxis({40 0}, 75, 6,,,'5.1');
      call gpoint(sepallen, petallen, spec_no, 'red');
      labs = "Sepallen vs Petallen";
      call gstrlen(len, labs,2,'swiss');
      call gscript(60-len/2,-14,labs,,,2,'swiss');

      /*-- Create a new segment */
   call gopen("all4");
      call gport({50 0, 100 50});  /* change viewport, lower right ----*/
      call ginclude("sepal");      /* include sepal in this graph -----*/
      call gport({0 50, 50 100});  /* change the viewport, upper left  */
      call ginclude("petal");      /* include petal -------------------*/
      call gport({0 0, 50 50});    /* change the viewport, lower left  */
      call ginclude("spwid");      /* include spwid -------------------*/
      call gport({50 50, 100 100});/* change the viewport, upper right */
      call ginclude("splen");      /* include splen -------------------*/

   call gshow("all4");
Output 17.3.1: Petal Length versus Petal Width