Submitting SAS Statements
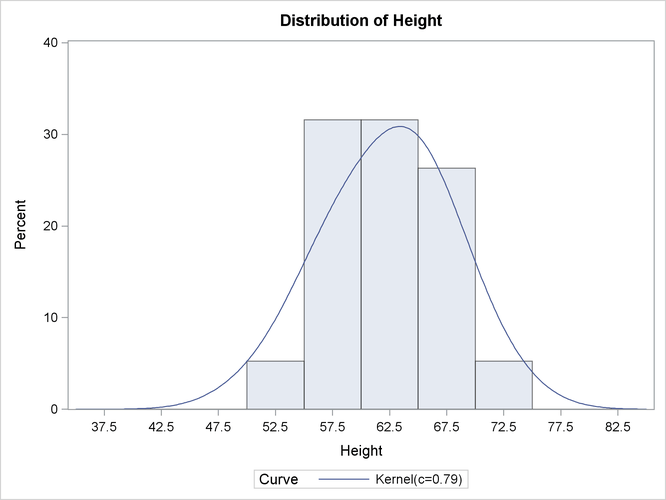
If you use the SUBMIT statement to call a SAS procedure that creates a graph, that graph is sent to the current ODS destination. The following statements call the UNIVARIATE procedure, which creates a histogram as part of the analysis:
ods graphics on;

proc iml;
msg1 = "First PRINT Statement in PROC IML";
msg2 = "Second PRINT Statement in PROC IML";
print msg1;

submit;
ods select Moments Histogram;
proc univariate data=Sashelp.Class;
   var Height;
   histogram / kernel;
run;
endsubmit;

print msg2;
ods graphics off;
When you run the program, the PROC UNIVARIATE output is interleaved with the PROC IML output. The output from the program is shown in Figure 10.6 through Figure 10.8.