Language Reference
CALL BOX (x <*>TYPE="VBox" | "HBox" <*>CATEGORY=CategoryVector <*>GROUP=GroupVector <*>GROUPOPT=GroupOption <*>DATALABEL=DataLabelVector <*>OPTION=BoxOption <*>ORDER="DATA" | "UNFORMATTED" <*>GRID={"X" <,"Y">} <*>LABEL={XLabel <,YLabel>} <*>XVALUES=xValues<*>YVALUES=yValues<*>PROCOPT=ProcOption<*>OTHER=Stmts );
The BOX subroutine displays a bar chart by calling the SGPLOT procedure. The argument x is a vector that contains character or (discrete) numeric data to plot. The BOX subroutine is not a comprehensive interface to the SGPLOT procedure. It is intended for creating simple bar charts for exploratory data analysis. The ODS statistical graphics subroutines are described in Chapter 15: Statistical Graphics.
A simple example follows:
use sashelp.cars where(type ? {"SUV" "Truck" "Sedan"});
read all var {MPG_City Origin Type Make Model};
close sashelp.cars;
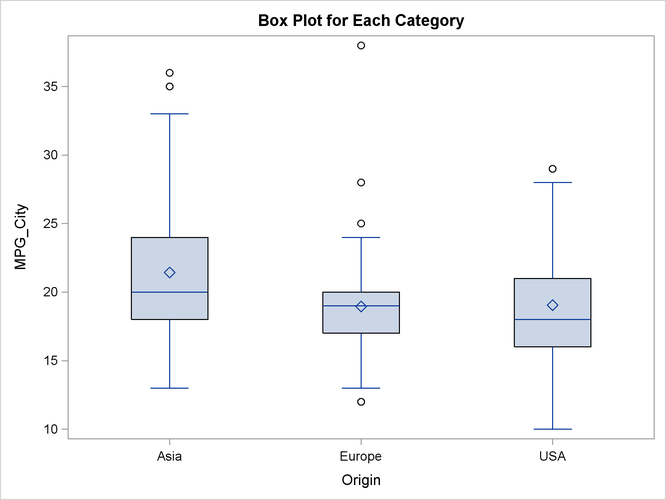
title "Box Plot for Each Category";
call Box(MPG_City) Category=Origin;
Specify the x vector inside parentheses and specify all options outside the parentheses. Use the global TITLE and FOOTNOTE statements to specify titles and footnotes. Each option corresponds to a statement or option in the SGPLOT procedure.
Valid values for the TYPE= option are "VBox" and "HBox." The "VBox" value creates a vertical box plot and corresponds to the VBOX statement in PROC SGPLOT. The "HBox" value creates a horizontal box plot and corresponds to the HBOX statement.
The following options correspond to options in the VBOX and HBOX statements in the SGPLOT procedure:
- CATEGORY=
-
specifies a vector of values that define a category variable for the plot. A box plot is created for each distinct value of the category variable.
- GROUP=
-
specifies a vector of values that determine groups in the plot. You can use a numeric or character vector. This option corresponds to the GROUP= option in the VBOX and HBOX statements.
- GROUPOPT=
-
specifies a character vector of values that determine how groups are displayed. This option is ignored if the GROUP= option is not specified. You can specify one or both of the following values:
-
"Cluster" or "Overlay" specifies how to display grouped boxes. This option corresponds to the GROUPDISPLAY= option in the VBOX and HBOX statements in PROC SGPLOT. The default value is "Cluster."
-
"Ascending," "Descending," or "Data" specifies how to display grouped boxes. This option corresponds to the GROUPORDER= option in the VBOX and HBOX statements in PROC SGPLOT. The default value is "Ascending."
For example, a valid call is
GROUPOPT={"Cluster" "Data"}; -
- DATALABEL=
-
specifies a vector of values that are used to label outliers.
- OPTION=
-
specifies a character matrix or string literal. This option is used verbatim to specify options in the HBOX or VBOX statement.
The BOX subroutine also supports the following options. The BAR subroutine documents these options and gives an example of their usage.
- ORDER=
-
specifies the order in which discrete tick values are to be placed on the categorical axis.
- GRID=
-
specifies whether to display grid lines for the X or Y axis.
- LABEL=
-
specifies axis labels for the X or Y axis.
- XVALUES=
-
specifies a vector of values for ticks for the X axis.
- YVALUES=
-
specifies a vector of values for ticks for the Y axis.
- PROCOPT=
-
specifies options in the PROC SGPLOT statement.
- OTHER=
-
specifies statements in the SGPLOT procedure.
If you use the LABEL= option to specify a single label, that label is used to label the interval axis that shows the distribution of data values. If you specify two labels, the first labels the categorical variable (if you use the CATEGORY= option) and the second labels the data axis.
The following statements provide additional examples of creating box plots:
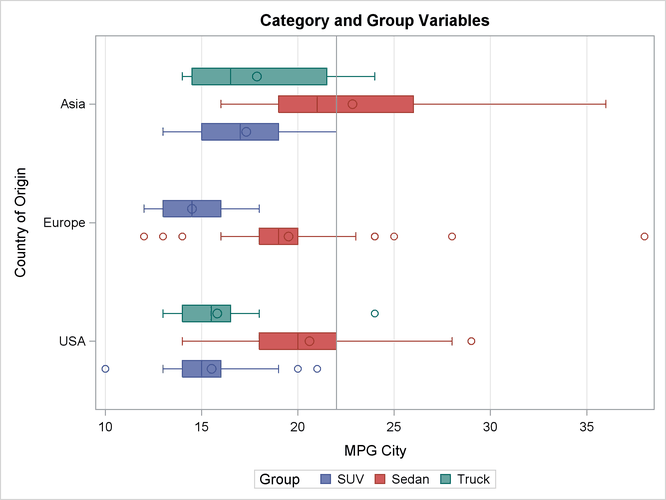
title "Category and Group Variables";
call Box(MPG_City) Type="HBox" Category=Origin group=Type grid="x"
label={"Country of Origin" "MPG City"}
other="refline 22 / axis=x;";
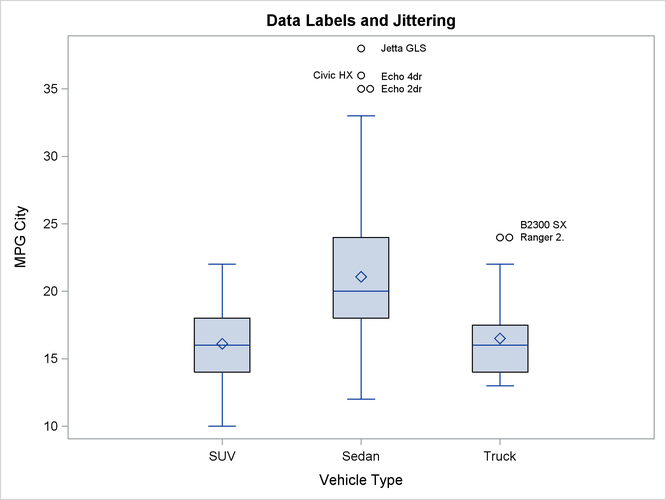
title "Data Labels and Jittering";
call Box(MPG_City) Category=Type label={"Vehicle Type" "MPG City"}
datalabel=putc(Model,"$10.") option="spread";