CALL HEATMAPDISC (x <*>COLORRAMP=ColorRamp <*>XVALUES=xValues<*>YVALUES=yValues<*>XAXISTOP=top<*>DISPLAYOUTLINES=outlines<*>TITLE=plotTitle<*>LEGENDTITLE=legendTitle<*>LEGENDLOC=loc <*>SHOWLEGEND=show ) ;
The HEATMAPDISC subroutine is part of the IMLMLIB library. The HEATMAPDISC subroutine displays a heat map of a numeric or character matrix whose values are assumed to have a small number of discrete values. The heat map is produced by calling the SGRENDER procedure to render a template, which is created at run time. The argument x is a matrix that contains numeric or character data. The ODS statistical graphics subroutines are described in Chapter 15: Statistical Graphics.
In addition to visualizing matrices with discrete values, you can use the HEATMAPDISC subroutine to visualize quantiles of a continuous variable.
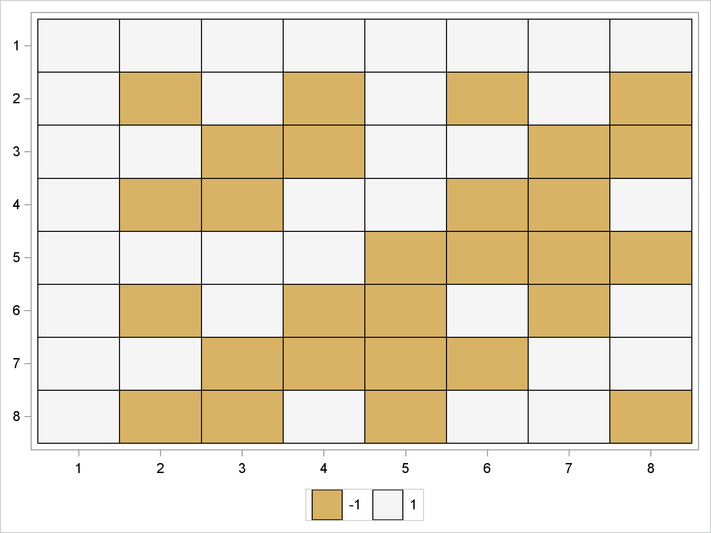
A simple example follows. The HADAMARD function generates an ![]() matrix, each element is either
matrix, each element is either ![]() or
or ![]() . The HEATMAPDISC subroutine creates the image in Figure 24.157, which uses two colors to visualize the matrix.
. The HEATMAPDISC subroutine creates the image in Figure 24.157, which uses two colors to visualize the matrix.
h = hadamard(8);
run HeatmapDisc(h);
Specify the x vector inside parentheses and specify all options outside the parentheses. Titles are specified by using the TITLE= option. Each option corresponds to a statement or option in the graph template languge (GTL).
Except for the SCALE= option, the options for the HEATMAPDISC subroutine are the same as for the HEATMAPCONT subroutine.
You can use the PALETTE function to obtain colors from a wide variety of discrete color palettes.