CALL BAR (x <*>TYPE="VBar" | "HBar" <*>GROUP=GroupVector <*>GROUPOPT=GroupOption <*>FREQ=FreqVector <*>ORDER="DATA" | "UNFORMATTED" <*>GRID={"X" <,"Y">} <*>LABEL={XLabel <,YLabel>} <*>XVALUES=xValues<*>YVALUES=yValues<*>PROCOPT=ProcOption<*>OTHER=Stmts ) ;
The BAR subroutine displays a bar chart by calling the SGPLOT procedure. The argument x is a vector that contains character or (discrete) numeric data to plot. The BAR subroutine is not a comprehensive interface to the SGPLOT procedure. It is intended for creating simple bar charts for exploratory data analysis. The ODS statistical graphics subroutines are described in Chapter 15: Statistical Graphics.
A simple example follows:
use sashelp.cars;
read all var {origin};
close sashelp.cars;

title "Bar Chart with Default Properties";
call Bar(origin);

Specify the x vector inside parentheses and specify all options outside the parentheses. Use the global TITLE and FOOTNOTE statements to specify titles and footnotes. Each option corresponds to a statement or option in the SGPLOT procedure.
Valid values for the TYPE= option are “VBar” and “HBar.” The “VBar” value creates a vertical bar chart and corresponds to the VBAR statement in PROC SGPLOT. The “HBar” value creates a horizontal bar chart and corresponds to the HBAR statement.
The following options correspond to options in the VBAR and HBAR statements in the SGPLOT procedure:
- GROUP=
-
specifies a vector of values that determine groups in the plot. You can use a numeric or character vector. This option corresponds to the GROUP= option in the VBAR and HBAR statements.
- GROUPOPT=
-
specifies a character vector of values that determine how groups are displayed. This option is ignored if the GROUP= option is not specified. You can specify the following values:
-
“Stack” or “Cluster” specifies how to display grouped bars. These values correspond to the GROUPDISPLAY= option in the VBAR and HBAR statements in PROC SGPLOT. The default value is “Stack.”
-
“Ascending,” “Descending,” or “Data” specifies how to display grouped bars. These values corresponds to the GROUPORDER= option in the VBAR and HBAR statements in PROC SGPLOT. The default value is “Ascending.”
For example, a valid call is
GROUPOPT={"Cluster" "Data"}; -
- FREQ=
-
specifies a vector of numerical values that are used as frequencies for each corresponding value of the x variable. This option corresponds to the FREQ= option in the VBAR and HBAR statements in PROC SGPLOT.
Some options are common to all of the ODS graphics routines. The following common options specify options in the XAXIS and YAXIS statements in the SGPLOT procedure:
- ORDER=
-
specifies the order in which discrete tick values are to be placed on the categorical axis. Valid options are “DATA” and “UNFORMATTED.” This option corresponds to the DISCRETEORDER= option in the XAXIS and YAXIS statements.
- GRID=
-
specifies whether to display grid lines for the X or Y axis. This option corresponds to the GRID option in the XAXIS and YAXIS statements. Valid values follow:
-
GRID={X}displays grid lines for the X axis. -
GRID={Y}displays grid lines for the Y axis. -
GRID={X, Y}displays grid lines for both axes.
-
- LABEL=
-
specifies axis labels for the X or Y axis. If the argument is a scalar, the value of the argument is used for the X axis label. If the argument has two elements, the first is used for the X axis label and the second for the Y axis label. If this option is not specified, the labels “X” and “Y” are used for labels.
- XVALUES=
-
specifies a vector of values for ticks for the X axis.
- YVALUES=
-
specifies a vector of values for ticks for the Y axis.
In addition, the following common options specify additional options and statements in the SGPLOT procedure:
- PROCOPT=
-
specifies a character matrix or string literal. The value is used verbatim to specify options in the PROC SGPLOT statement.
- OTHER=
-
specifies a character matrix or string literal. You can use this option to specify one or more complete statements in the SGPLOT procedure. For example, you can specify multiple REFLINE statements and an INSET statement.
The following example shows how to create a bar chart that uses the GROUP=, GROUPOPT=, GRID=, and LABEL= options:
use sashelp.cars where(type ? {"SUV" "Truck" "Sedan"});
read all var {origin type};
close sashelp.cars;

title "Horizontal Bar Chart, group and order categories";
/* 1. Use the GROUP= option to assign a group to each observation
 * 2. Use the GROUPOPT= option to specify the grouping options
 * 3. Use the GRID= and LABEL= options to improve the appearance
 */
call Bar(origin) type="HBar" group=type groupopt="Cluster"
         grid="X" label="Origin";
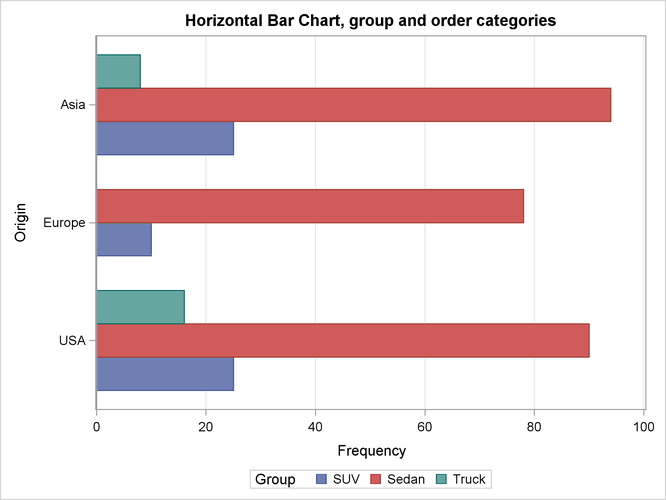
Notice that the TYPE=“HBar” option results in the bars being drawn horizontally, as shown in Figure 24.50. Also, because the categories are displayed on the vertical axis, the LABEL= option changes the label on the vertical axis.
The next example shows how to create a bar chart from tabulated data. The frequencies for each category are precomputed. The FREQ= option specifies the vector of frequencies. The ORDER= option requests that the categories be displayed in the same order as they appear in the data.
y    = { 3  2  1 .};
freq = {30 20 10 5};
title "Freq and Missing Category";
call Bar(y) freq=freq order="Data";
