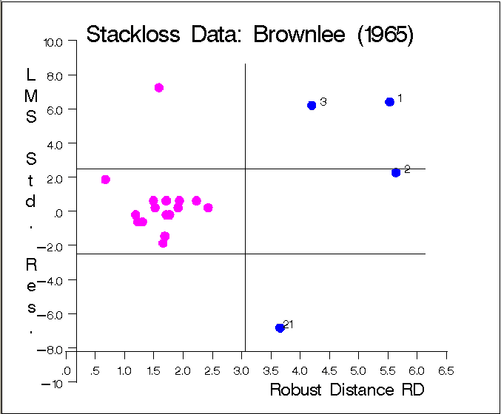
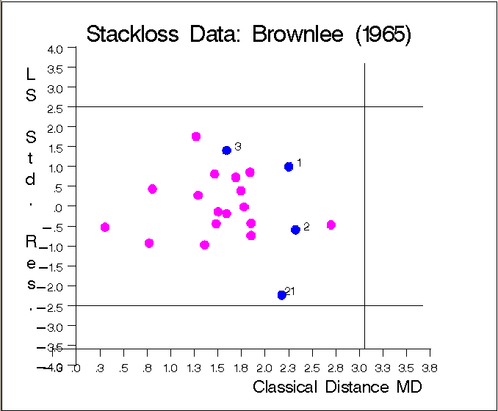
The graphs in Output 12.7.1 and Output 12.7.2 show the following:
-
the plot of standardized LMS residuals vs. robust distances

-
the plot of standardized LS residuals vs. Mahalanobis distances

In the first plot, you see that case 4 is a regression outlier but not a leverage point, so it is a vertical outlier. Cases 1, 3, and 21 are bad leverage points, whereas case 2 is a good leverage point. Note that case 21 lies near the boundary line between vertical outliers and bad leverage points and that case 2 is very close to the boundary between good and bad leverage points.