ODSGRAPH Call
CALL ODSGRAPH (name, template, matrix1 <, matrix2, …, matrix13> ) ;
The ODSGRAPH subroutine renders an ODS statistical graph that is defined by a template.
The input arguments to the ODSGRAPH subroutine are as follows:
- name
-
is a character matrix or quoted literal that assigns a name to the graph. The name is used to identify the output graph in the SAS Results window.
- template
-
is a character matrix or quoted literal that names the template used to render the graph.
- matrix
-
is a matrix whose columns are supplied to the template. You can specify up to 13 arguments. The name of each column must be specified by using the MATTRIB statement or the COLNAME= option in a READ statement.
The ODSGRAPH subroutine (which requires a SAS/GRAPH license) renders a graph defined by the input template. Data for the graph are in the columns of the matrix arguments. Column names are assigned to the matrices by using the MATTRIB statement or by using the COLNAME= option in a READ statement. This is illustrated in the following example, which produces a three-dimensional surface plot:
proc template;
  define statgraph SurfacePlot;
    BeginGraph;
    layout overlay3d;
      surfaceplotparm x=x y=y z=z / surfacetype=fill;
    endlayout;
    EndGraph;
  end;
run;

ods graphics on;
title "Surface Plot";

proc iml;
XDiv = do( -5, 5, 0.25 );
YDiv = do( -5, 5, 0.25 );
nX = ncol(XDiv);
nY = ncol(YDiv);
x = shape(repeat(XDiv, nY, 1), 0, 1);
y = shape(repeat(YDiv`, 1, nX), 0, 1);
z = sin( sqrt( x##2 + y##2 ) );
matrix = x || y || z;
mattrib matrix colname={"x" "y" "z"};
call odsgraph("surface", "SurfacePlot", matrix);
quit;

ods graphics off;
Figure 23.224: ODS Graphic
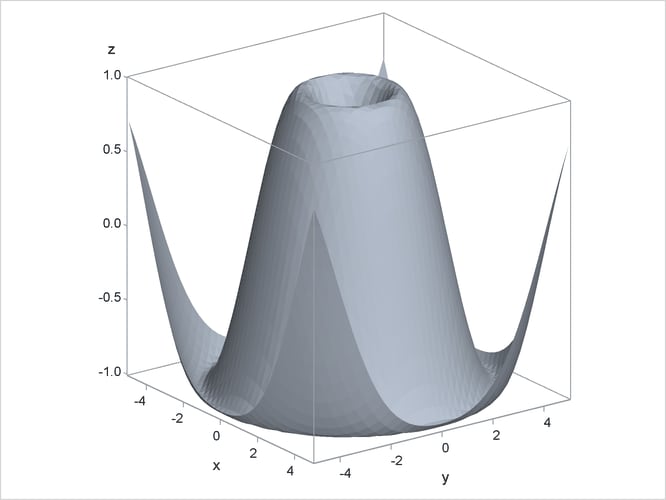
In the example, the TEMPLATE procedure defines a template for a surface plot. The ODSGRAPH subroutine calls ODS to render the graph by using the layout in the template. (You can render the graph in any ODS destination.) The data for the graph are contained in a matrix. The MATTRIB statement associates the columns of the matrix with the variable names required by the template.
You can also create graphs from data that are read from a data set. If x, y, and z are variables in a data set, then the following statements plot these variables:
use myData;
read all into matrix[colname = c];
call odsgraph("surface", "SurfacePlot", matrix);
Since column names created via a READ statement are permanently associated with the INTO matrix, you do not need to use a MATTRIB statement for this example.
The sample programs distributed with SAS/IML software include other examples of plots that are available by using ODS Statistical Graphics.