Variable Transformations
Example: Define a Custom Transformation
This example illustrates how to define a custom transformation by using the Variable Transformation Wizard.
Note: This example is intended for SAS programmers who are comfortable writing DATA step statements.
Kimball and Mulekar (2004) analyze the intensification tendency of Atlantic cyclones. This example is based on their analysis and graphics.
In this example, you use the Variable Transformation Wizard to write DATA step statements that creates a character variable,
Tendency, that encodes whether a storm is strengthening or weakening. The Tendency variable is computed by transforming a numeric variable for wind speed. For each observation of each storm, the Tendency variable has the value "Intensifying" when the wind speed is stronger than it was for the previous observation, "Steady"
when the wind speed stays the same, and "Weakening" when the wind speed is less than it was for the previous observation.
To transform a variable with a DATA step:
-
Open the Hurricanes data set.
The wind speed is contained in the
wind_ktsvariable. Note that the values of thewind_ktsvariable are rounded to the nearest 5 knots. The name of each storm is contained in thenamevariable.The data are grouped according to storm name, so an algorithm for creating the
Tendencyvariable is as follows.For each named storm: Compute the difference between the current wind speed and the previous wind speed by using the DIF function in Base SAS software. Specify a value for the tendency variable according to whether the difference in wind speed is less than zero, exactly zero, or greater than zero.If you were to write a DATA step to create the
Tendencyvariable in a data set, you might write statements like the following. The DATA step creates two new variables: a numeric variable calleddif_wind_ktsand a character variable of length 12 calledTendency. The BY statement is used to loop through the names of cyclones; the NOTSORTED option specifies that theNamevariable in the input data set is not sorted in alphabetic order.data WindTendency; set Hurricanes; by name notsorted; length Tendency $12; dif_wind_kts = dif(wind_kts); if first.name then do; Tendency = "Intensifying"; dif_wind_kts = .; end; else do; if dif_wind_kts < 0 then Tendency = "Weakening"; else if dif_wind_kts > 0 then Tendency = "Intensifying"; else Tendency = "Steady"; end; run;The
Tendencyvariable is assigned to "Intensifying" for the first observation of each storm because the storm system was weaker six hours earlier. Thedif_wind_ktsvariable is assigned a missing value for the first observation of each storm because the previous wind speed is unknown.For subsequent storm observations, the
dif_wind_ktsvariable is assigned the results of the DIF function, which computes the difference between the current and previous values ofwind_kts.Submitting this DATA step in the Variable Transformation Wizard is easy. No changes are required.
-
Select → from the main menu.
-
Select from the list on the left side of the page, as shown in Figure 32.21.
-
Click .
The wizard displays the page shown in Figure 32.22.
-
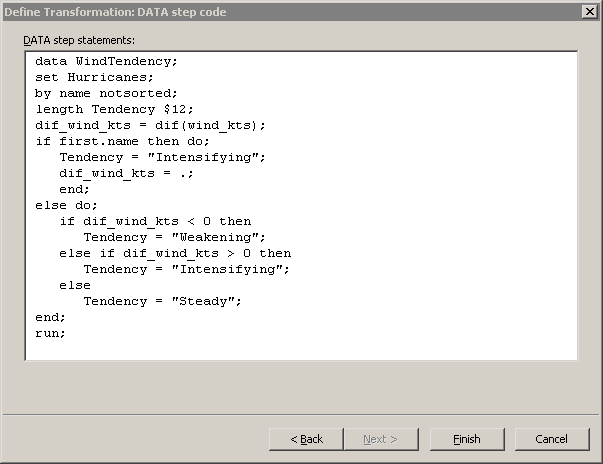
Type the DATA step into the Variable Transformation Wizard, as shown in Figure 32.23.
Figure 32.23: A Custom Transformation
-
Click .
SAS/IML Studio scans the contents of the window and determines that the
nameandwind_ktsvariables are needed by the DATA step. The input data set,Hurricanes, is created in theWORKlibrary. The input data set contains thenameandwind_ktsvariables.Next, the DATA step executes on the SAS server. The DATA step creates the output data set,
WindTendency, which contains thedif_wind_ktsandTendencyvariables. Thedif_wind_ktsandTendencyvariables are copied from the output data set to the SAS/IML Studio data table. -
Scroll the data table to the extreme right to see the newly created variables.
You can now investigate the relationship between the
Tendencyvariable and other variables of interest. -
Create a box plot of
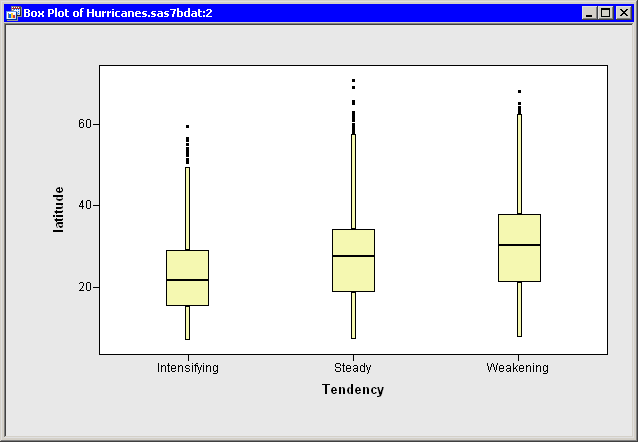
latitudeversusTendency.The box plot in Figure 32.24 shows the distribution of latitudes for intensifying, steady, and weakening storms. Intensifying storms tend to occur at more southerly latitudes, whereas weakening storms tend to occur at more northerly latitudes.
Figure 32.24: Latitude Stratified by Intensification Tendency