Data Smoothing: Polynomial Regression
Output Variables Tab
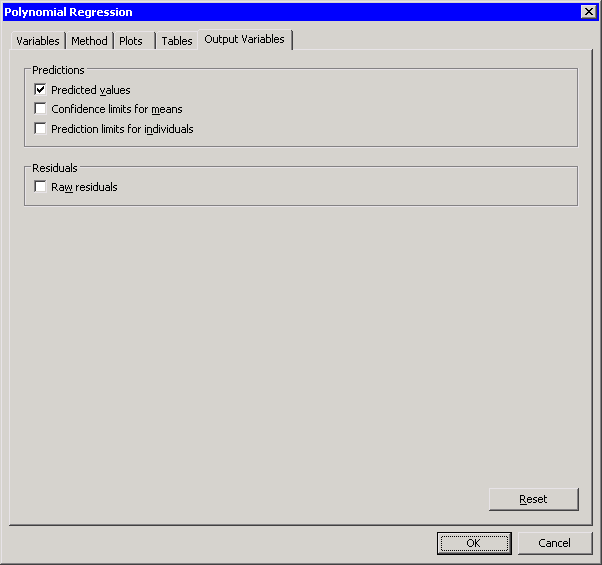
You can use the Output Variables tab to add analysis variables to the data table. (See Figure 20.8.) If you request a plot that uses one of the output variables, then that variable is automatically created even if you did not explicitly select the variable on the Output Variables tab.
The following list describes each output variable and indicates how it is named. Y represents the name of the response variable.
- Predicted values
-
adds predicted values. The variable is namedPolyP_Y. - Confidence limits for means
-
adds 95% confidence limits for the expected value (mean). The variables are namedPolyLclm_Y andPolyUclm_Y. - Prediction limits for individuals
-
adds 95% confidence limits for an individual prediction. The variables are namedPolyLcli_Y andPolyUcli_Y. - Raw residuals
-
adds residuals, which are calculated as observed values minus predicted values. The variable is namedPolyR_Y.
Figure 20.8: The Output Variables Tab